
|
Oppenheimer Holdings Inc. (OPY) Évaluation DCF |
Entièrement Modifiable: Adapté À Vos Besoins Dans Excel Ou Sheets
Conception Professionnelle: Modèles Fiables Et Conformes Aux Normes Du Secteur
Pré-Construits Pour Une Utilisation Rapide Et Efficace
Compatible MAC/PC, entièrement débloqué
Aucune Expertise N'Est Requise; Facile À Suivre
Oppenheimer Holdings Inc. (OPY) Bundle
Vous cherchez à évaluer la valeur intrinsèque d'Oppenheimer Holdings Inc.? Notre calculatrice (OPY) DCF intègre des données réelles avec des fonctionnalités de personnalisation approfondies, vous permettant d'affiner vos prévisions et de faire des choix d'investissement plus éclairés.
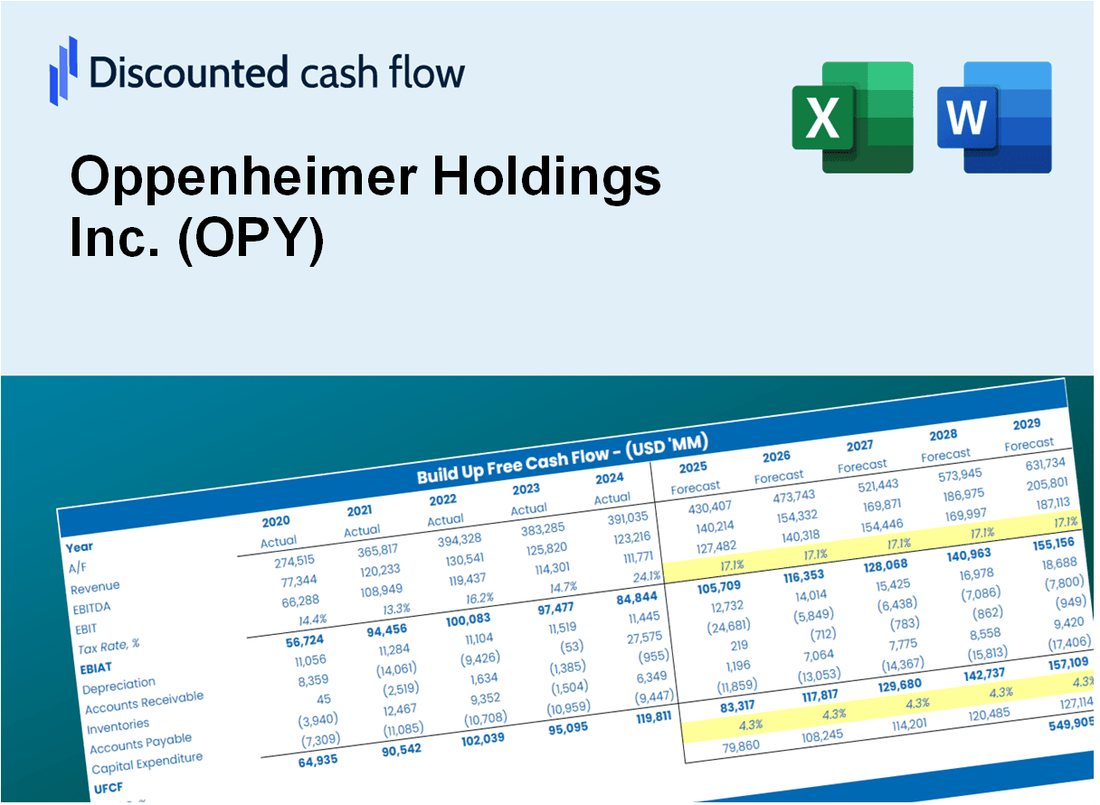
Discounted Cash Flow (DCF) - (USD MM)
| Year | AY1 2020 |
AY2 2021 |
AY3 2022 |
AY4 2023 |
AY5 2024 |
FY1 2025 |
FY2 2026 |
FY3 2027 |
FY4 2028 |
FY5 2029 |
|---|---|---|---|---|---|---|---|---|---|---|
| Revenue | 1,198.7 | 1,394.0 | 1,110.9 | 1,248.8 | 1,432.5 | 1,515.3 | 1,602.8 | 1,695.4 | 1,793.4 | 1,897.0 |
| Revenue Growth, % | 0 | 16.3 | -20.31 | 12.41 | 14.71 | 5.78 | 5.78 | 5.78 | 5.78 | 5.78 |
| EBITDA | 218.0 | 268.6 | 103.8 | 152.6 | 231.0 | 227.7 | 240.9 | 254.8 | 269.5 | 285.1 |
| EBITDA, % | 18.18 | 19.27 | 9.34 | 12.22 | 16.13 | 15.03 | 15.03 | 15.03 | 15.03 | 15.03 |
| Depreciation | 33.3 | 34.1 | 34.4 | 37.2 | 37.3 | 42.1 | 44.6 | 47.1 | 49.9 | 52.8 |
| Depreciation, % | 2.78 | 2.45 | 3.1 | 2.98 | 2.6 | 2.78 | 2.78 | 2.78 | 2.78 | 2.78 |
| EBIT | 184.7 | 234.5 | 69.4 | 115.4 | 193.7 | 185.6 | 196.3 | 207.6 | 219.6 | 232.3 |
| EBIT, % | 15.41 | 16.82 | 6.25 | 9.24 | 13.53 | 12.25 | 12.25 | 12.25 | 12.25 | 12.25 |
| Total Cash | 35.4 | 213.8 | 112.4 | 28.8 | 33.2 | 100.1 | 105.9 | 112.0 | 118.5 | 125.3 |
| Total Cash, percent | .0 | .0 | .0 | .0 | .0 | .0 | .0 | .0 | .0 | .0 |
| Account Receivables | 1,360.5 | 1,445.3 | 1,466.3 | 1,414.4 | 1,579.8 | 1,515.3 | 1,602.8 | 1,695.4 | 1,793.4 | 1,897.0 |
| Account Receivables, % | 113.5 | 103.68 | 131.99 | 113.26 | 110.28 | 100 | 100 | 100 | 100 | 100 |
| Inventories | .0 | .0 | .0 | .0 | .0 | .0 | .0 | .0 | .0 | .0 |
| Inventories, % | 0 | 0 | 0 | 0 | 0 | 0 | 0 | 0 | 0 | 0 |
| Accounts Payable | 44.8 | 76.7 | 102.2 | 82.8 | 65.8 | 89.9 | 95.1 | 100.6 | 106.4 | 112.5 |
| Accounts Payable, % | 3.74 | 5.5 | 9.2 | 6.63 | 4.59 | 5.93 | 5.93 | 5.93 | 5.93 | 5.93 |
| Capital Expenditure | -4.5 | -8.3 | -16.3 | -17.1 | -5.1 | -12.6 | -13.3 | -14.1 | -14.9 | -15.8 |
| Capital Expenditure, % | -0.37775 | -0.5931 | -1.47 | -1.37 | -0.35937 | -0.83284 | -0.83284 | -0.83284 | -0.83284 | -0.83284 |
| Tax Rate, % | 32.34 | 32.34 | 32.34 | 32.34 | 32.34 | 32.34 | 32.34 | 32.34 | 32.34 | 32.34 |
| EBITAT | 134.4 | 165.9 | 49.3 | 74.4 | 131.1 | 128.7 | 136.1 | 144.0 | 152.3 | 161.1 |
| Depreciation | ||||||||||
| Changes in Account Receivables | ||||||||||
| Changes in Inventories | ||||||||||
| Changes in Accounts Payable | ||||||||||
| Capital Expenditure | ||||||||||
| UFCF | -1,152.5 | 138.8 | 71.9 | 127.1 | -19.2 | 246.8 | 85.0 | 89.9 | 95.1 | 100.6 |
| WACC, % | 9.2 | 9.07 | 9.09 | 8.69 | 8.88 | 8.99 | 8.99 | 8.99 | 8.99 | 8.99 |
| PV UFCF | ||||||||||
| SUM PV UFCF | 500.4 | |||||||||
| Long Term Growth Rate, % | 2.00 | |||||||||
| Free cash flow (T + 1) | 103 | |||||||||
| Terminal Value | 1,469 | |||||||||
| Present Terminal Value | 955 | |||||||||
| Enterprise Value | 1,456 | |||||||||
| Net Debt | 654 | |||||||||
| Equity Value | 801 | |||||||||
| Diluted Shares Outstanding, MM | 11 | |||||||||
| Equity Value Per Share | 71.34 |
What You Will Receive
- Pre-Filled Financial Model: Oppenheimer Holdings Inc.'s actual data facilitates accurate DCF valuation.
- Comprehensive Forecast Control: Modify revenue growth, profit margins, WACC, and other essential factors.
- Real-Time Calculations: Automatic updates provide immediate feedback as adjustments are made.
- Investor-Ready Template: A polished Excel file crafted for high-quality valuation presentations.
- Customizable and Reusable: Designed for adaptability, allowing for repeated application in detailed forecasts.
Key Features
- Comprehensive Data: Oppenheimer Holdings Inc.'s (OPY) historical financial statements and detailed forecasts.
- Customizable Parameters: Adjust WACC, tax rates, revenue growth, and EBITDA margins as needed.
- Real-Time Calculations: View Oppenheimer's (OPY) intrinsic value update instantly.
- Intuitive Visualizations: Dashboard graphs illustrate valuation outcomes and essential metrics.
- Designed for Precision: A professional-grade tool for analysts, investors, and finance professionals.
How It Works
- Download the Template: Gain immediate access to the Excel-based Oppenheimer Holdings Inc. (OPY) DCF Calculator.
- Input Your Assumptions: Modify the yellow-highlighted cells for growth rates, WACC, margins, and other variables.
- Instant Calculations: The model automatically recalculates Oppenheimer’s intrinsic value.
- Test Scenarios: Experiment with various assumptions to assess potential changes in valuation.
- Analyze and Decide: Leverage the results to inform your investment or financial analysis.
Why Choose This Calculator for Oppenheimer Holdings Inc. (OPY)?
- Accurate Data: Utilize real Oppenheimer financials for dependable valuation outcomes.
- Customizable: Tailor essential parameters such as growth rates, WACC, and tax rates to align with your forecasts.
- Time-Saving: Pre-configured calculations save you from starting from the ground up.
- Professional-Grade Tool: Crafted for investors, analysts, and financial consultants.
- User-Friendly: Easy-to-navigate design and clear instructions ensure accessibility for all users.
Who Should Use This Product?
- Investors: Evaluate Oppenheimer Holdings Inc. (OPY) for informed stock trading decisions.
- CFOs and Financial Analysts: Optimize valuation methodologies and assess financial forecasts.
- Startup Founders: Understand the valuation strategies of established firms like Oppenheimer Holdings Inc. (OPY).
- Consultants: Provide comprehensive valuation analyses for client projects.
- Students and Educators: Utilize current market data to enhance learning in valuation practices.
What the Template Contains
- Operating and Balance Sheet Data: Pre-filled Oppenheimer Holdings Inc. (OPY) historical data and forecasts, including revenue, EBITDA, EBIT, and capital expenditures.
- WACC Calculation: A dedicated sheet for Weighted Average Cost of Capital (WACC), featuring parameters like Beta, risk-free rate, and share price.
- DCF Valuation (Unlevered and Levered): Editable Discounted Cash Flow models displaying intrinsic value with comprehensive calculations.
- Financial Statements: Pre-loaded financial statements (annual and quarterly) to facilitate thorough analysis.
- Key Ratios: Includes profitability, leverage, and efficiency ratios for Oppenheimer Holdings Inc. (OPY).
- Dashboard and Charts: Visual summary of valuation outputs and assumptions to simplify the analysis of results.
Disclaimer
All information, articles, and product details provided on this website are for general informational and educational purposes only. We do not claim any ownership over, nor do we intend to infringe upon, any trademarks, copyrights, logos, brand names, or other intellectual property mentioned or depicted on this site. Such intellectual property remains the property of its respective owners, and any references here are made solely for identification or informational purposes, without implying any affiliation, endorsement, or partnership.
We make no representations or warranties, express or implied, regarding the accuracy, completeness, or suitability of any content or products presented. Nothing on this website should be construed as legal, tax, investment, financial, medical, or other professional advice. In addition, no part of this site—including articles or product references—constitutes a solicitation, recommendation, endorsement, advertisement, or offer to buy or sell any securities, franchises, or other financial instruments, particularly in jurisdictions where such activity would be unlawful.
All content is of a general nature and may not address the specific circumstances of any individual or entity. It is not a substitute for professional advice or services. Any actions you take based on the information provided here are strictly at your own risk. You accept full responsibility for any decisions or outcomes arising from your use of this website and agree to release us from any liability in connection with your use of, or reliance upon, the content or products found herein.