
|
Page Industries Limited (PageInd.NS) Évaluation DCF |
Entièrement Modifiable: Adapté À Vos Besoins Dans Excel Ou Sheets
Conception Professionnelle: Modèles Fiables Et Conformes Aux Normes Du Secteur
Pré-Construits Pour Une Utilisation Rapide Et Efficace
Compatible MAC/PC, entièrement débloqué
Aucune Expertise N'Est Requise; Facile À Suivre
Page Industries Limited (PAGEIND.NS) Bundle
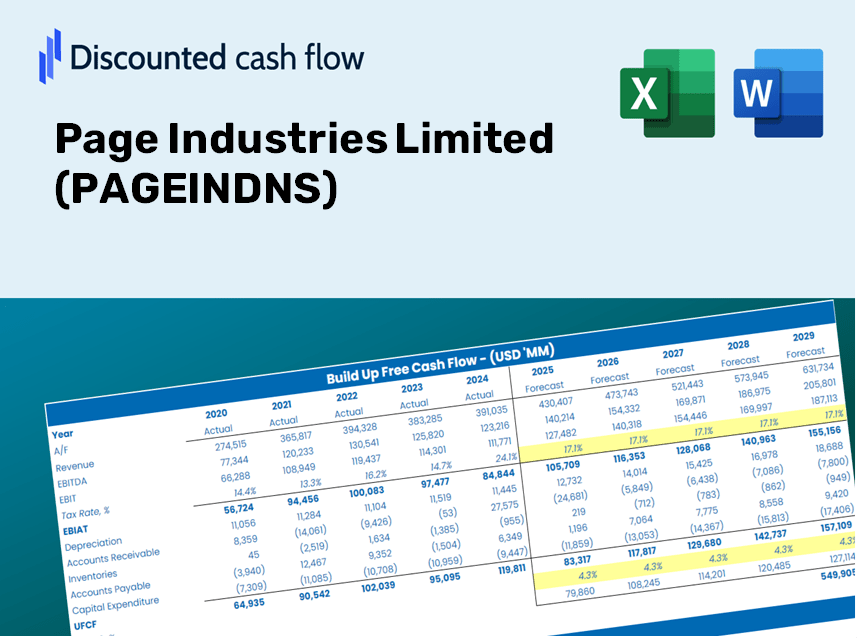
Découvrez la vraie valeur de Page Industries Limited (PageIndns) avec notre calculatrice avancée DCF! Ajustez les hypothèses clés, explorez divers scénarios et évaluez les effets des modifications sur Page Industries Limited (PageIndns) Valation - le tout dans un seul modèle Excel.
Discounted Cash Flow (DCF) - (USD MM)
| Year | AY1 2021 |
AY2 2022 |
AY3 2023 |
AY4 2024 |
AY5 2025 |
FY1 2026 |
FY2 2027 |
FY3 2028 |
FY4 2029 |
FY5 2030 |
|---|---|---|---|---|---|---|---|---|---|---|
| Revenue | 28,329.6 | 37,252.3 | 47,141.9 | 45,470.9 | 49,349.1 | 57,125.0 | 66,126.2 | 76,545.7 | 88,607.0 | 102,568.8 |
| Revenue Growth, % | 0 | 31.5 | 26.55 | -3.54 | 8.53 | 15.76 | 15.76 | 15.76 | 15.76 | 15.76 |
| EBITDA | 5,460.7 | 8,064.4 | 8,774.7 | 8,922.2 | 11,241.9 | 11,646.6 | 13,481.7 | 15,606.0 | 18,065.1 | 20,911.6 |
| EBITDA, % | 19.28 | 21.65 | 18.61 | 19.62 | 22.78 | 20.39 | 20.39 | 20.39 | 20.39 | 20.39 |
| Depreciation | 629.1 | 654.7 | 780.9 | 903.7 | 992.3 | 1,100.6 | 1,274.0 | 1,474.7 | 1,707.1 | 1,976.1 |
| Depreciation, % | 2.22 | 1.76 | 1.66 | 1.99 | 2.01 | 1.93 | 1.93 | 1.93 | 1.93 | 1.93 |
| EBIT | 4,831.6 | 7,409.7 | 7,993.9 | 8,018.5 | 10,249.6 | 10,546.0 | 12,207.7 | 14,131.3 | 16,358.0 | 18,935.5 |
| EBIT, % | 17.06 | 19.89 | 16.96 | 17.63 | 20.77 | 18.46 | 18.46 | 18.46 | 18.46 | 18.46 |
| Total Cash | 4,347.0 | 2,789.7 | 6.7 | 3,139.7 | 4,616.1 | 4,467.8 | 5,171.8 | 5,986.8 | 6,930.1 | 8,022.1 |
| Total Cash, percent | .0 | .0 | .0 | .0 | .0 | .0 | .0 | .0 | .0 | .0 |
| Account Receivables | 1,371.2 | 1,650.8 | 1,481.0 | 1,625.0 | 1,916.1 | 2,270.1 | 2,627.8 | 3,041.9 | 3,521.2 | 4,076.0 |
| Account Receivables, % | 4.84 | 4.43 | 3.14 | 3.57 | 3.88 | 3.97 | 3.97 | 3.97 | 3.97 | 3.97 |
| Inventories | 5,886.5 | 10,071.8 | 16,175.4 | 11,772.7 | 8,588.7 | 14,329.5 | 16,587.4 | 19,201.0 | 22,226.5 | 25,728.8 |
| Inventories, % | 20.78 | 27.04 | 34.31 | 25.89 | 17.4 | 25.08 | 25.08 | 25.08 | 25.08 | 25.08 |
| Accounts Payable | 2,507.8 | 3,628.1 | 2,876.3 | 2,199.8 | 2,549.2 | 3,964.0 | 4,588.7 | 5,311.7 | 6,148.6 | 7,117.5 |
| Accounts Payable, % | 8.85 | 9.74 | 6.1 | 4.84 | 5.17 | 6.94 | 6.94 | 6.94 | 6.94 | 6.94 |
| Capital Expenditure | -153.3 | -979.6 | -1,656.5 | -960.9 | -795.7 | -1,189.4 | -1,376.8 | -1,593.8 | -1,844.9 | -2,135.6 |
| Capital Expenditure, % | -0.54127 | -2.63 | -3.51 | -2.11 | -1.61 | -2.08 | -2.08 | -2.08 | -2.08 | -2.08 |
| Tax Rate, % | 25.49 | 25.49 | 25.49 | 25.49 | 25.49 | 25.49 | 25.49 | 25.49 | 25.49 | 25.49 |
| EBITAT | 3,629.2 | 5,609.0 | 6,023.6 | 6,033.1 | 7,637.0 | 7,928.8 | 9,178.2 | 10,624.4 | 12,298.4 | 14,236.3 |
| Depreciation | ||||||||||
| Changes in Account Receivables | ||||||||||
| Changes in Inventories | ||||||||||
| Changes in Accounts Payable | ||||||||||
| Capital Expenditure | ||||||||||
| UFCF | -644.9 | 1,939.5 | -1,537.7 | 9,558.1 | 11,075.9 | 3,160.0 | 7,084.3 | 8,200.6 | 9,492.8 | 10,988.6 |
| WACC, % | 4.73 | 4.74 | 4.74 | 4.74 | 4.73 | 4.74 | 4.74 | 4.74 | 4.74 | 4.74 |
| PV UFCF | ||||||||||
| SUM PV UFCF | 33,221.7 | |||||||||
| Long Term Growth Rate, % | 4.00 | |||||||||
| Free cash flow (T + 1) | 11,428 | |||||||||
| Terminal Value | 1,554,750 | |||||||||
| Present Terminal Value | 1,233,675 | |||||||||
| Enterprise Value | 1,266,896 | |||||||||
| Net Debt | 235 | |||||||||
| Equity Value | 1,266,661 | |||||||||
| Diluted Shares Outstanding, MM | 11 | |||||||||
| Equity Value Per Share | 113,561.14 |
What You Will Receive
- Accurate PAGEINDNS Financial Data: Pre-populated with Page Industries’ historical and projected figures for in-depth analysis.
- Completely Customizable Template: Easily adjust key parameters such as revenue growth, WACC, and EBITDA %.
- Instantaneous Calculations: View the intrinsic value of Page Industries update in real-time based on your modifications.
- Professional Valuation Tool: Tailored for investors, analysts, and consultants aiming for precise DCF outcomes.
- Intuitive Design: Clear layout and straightforward instructions suitable for all skill levels.
Key Features
- Advanced DCF Calculator: Features comprehensive unlevered and levered DCF valuation models tailored for Page Industries Limited (PAGEINDNS).
- WACC Calculator: Ready-to-use Weighted Average Cost of Capital template with adjustable inputs specific to Page Industries Limited (PAGEINDNS).
- Editable Forecast Assumptions: Customize growth rates, capital expenditures, and discount rates to suit Page Industries Limited (PAGEINDNS).
- Built-In Financial Ratios: Evaluate profitability, leverage, and efficiency ratios relevant to Page Industries Limited (PAGEINDNS).
- Dashboard and Charts: Visual representations provide a clear overview of key valuation metrics for Page Industries Limited (PAGEINDNS).
How It Functions
- Step 1: Download the Excel file.
- Step 2: Examine Page Industries Limited's (PAGEINDNS) pre-filled financial information and projections.
- Step 3: Adjust key parameters such as revenue growth, WACC, and tax rates (highlighted cells).
- Step 4: Observe the DCF model update in real-time as you modify your assumptions.
- Step 5: Evaluate the outputs and utilize the findings for your investment strategies.
Why Opt for This Calculator?
- Reliable Information: Accurate financial data from Page Industries Limited ensures dependable valuation outcomes.
- Flexible Options: Modify essential parameters such as growth rates, WACC, and tax rates to align with your forecasts.
- Efficient: Pre-existing calculations save you the effort of building from the ground up.
- High-Quality Tool: Tailored for investors, analysts, and consultants alike.
- Easy to Use: A user-friendly interface and straightforward instructions cater to all levels of expertise.
Who Can Benefit from Page Industries Limited (PAGEINDNS)?
- Investors: Make informed decisions with a sophisticated valuation tool tailored for Page Industries Limited (PAGEINDNS).
- Financial Analysts: Enhance efficiency with a pre-designed DCF model that can be tailored to your needs.
- Consultants: Easily modify the template for impactful client presentations or detailed reports.
- Finance Enthusiasts: Expand your knowledge of valuation methods through real-world scenarios involving Page Industries Limited (PAGEINDNS).
- Educators and Students: Utilize it as a hands-on learning resource in finance-related studies.
Contents of the Template
- Pre-Filled Data: Contains Page Industries Limited's historical financial data and projections.
- Discounted Cash Flow Model: An editable DCF valuation model featuring automatic calculations.
- Weighted Average Cost of Capital (WACC): A dedicated worksheet for calculating WACC using user-defined inputs.
- Key Financial Ratios: Evaluate Page Industries Limited’s profitability, efficiency, and leverage metrics.
- Customizable Inputs: Easily modify revenue growth, margins, and tax rates.
- Clear Dashboard: Visual representations through charts and tables that summarize essential valuation results.
Disclaimer
All information, articles, and product details provided on this website are for general informational and educational purposes only. We do not claim any ownership over, nor do we intend to infringe upon, any trademarks, copyrights, logos, brand names, or other intellectual property mentioned or depicted on this site. Such intellectual property remains the property of its respective owners, and any references here are made solely for identification or informational purposes, without implying any affiliation, endorsement, or partnership.
We make no representations or warranties, express or implied, regarding the accuracy, completeness, or suitability of any content or products presented. Nothing on this website should be construed as legal, tax, investment, financial, medical, or other professional advice. In addition, no part of this site—including articles or product references—constitutes a solicitation, recommendation, endorsement, advertisement, or offer to buy or sell any securities, franchises, or other financial instruments, particularly in jurisdictions where such activity would be unlawful.
All content is of a general nature and may not address the specific circumstances of any individual or entity. It is not a substitute for professional advice or services. Any actions you take based on the information provided here are strictly at your own risk. You accept full responsibility for any decisions or outcomes arising from your use of this website and agree to release us from any liability in connection with your use of, or reliance upon, the content or products found herein.