
|
Paragon Banking Group Plc (PAG.L) Évaluation DCF |
Entièrement Modifiable: Adapté À Vos Besoins Dans Excel Ou Sheets
Conception Professionnelle: Modèles Fiables Et Conformes Aux Normes Du Secteur
Pré-Construits Pour Une Utilisation Rapide Et Efficace
Compatible MAC/PC, entièrement débloqué
Aucune Expertise N'Est Requise; Facile À Suivre
Paragon Banking Group PLC (PAG.L) Bundle
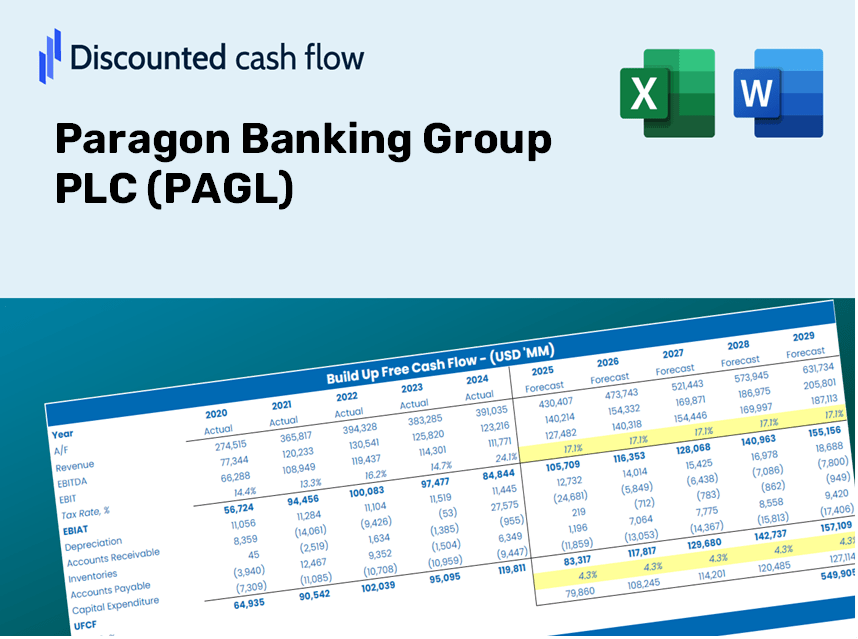
Que vous soyez un investisseur ou un analyste, cette calculatrice DCF de Paragon Banking Group PLC (PAGL) est votre ressource incontournable pour une évaluation précise. Chargé de données réelles de Paragon Banking Group, vous pouvez ajuster vos prévisions et observer les effets en temps réel.
Discounted Cash Flow (DCF) - (USD MM)
| Year | AY1 2020 |
AY2 2021 |
AY3 2022 |
AY4 2023 |
AY5 2024 |
FY1 2025 |
FY2 2026 |
FY3 2027 |
FY4 2028 |
FY5 2029 |
|---|---|---|---|---|---|---|---|---|---|---|
| Revenue | 309.7 | 354.5 | 426.9 | 455.1 | 1,313.2 | 1,777.7 | 2,406.6 | 3,257.9 | 4,410.3 | 5,970.4 |
| Revenue Growth, % | 0 | 14.47 | 20.42 | 6.61 | 188.55 | 35.37 | 35.37 | 35.37 | 35.37 | 35.37 |
| EBITDA | 132.2 | 220.0 | 423.4 | 207.5 | 260.4 | 957.7 | 1,296.4 | 1,755.0 | 2,375.8 | 3,216.2 |
| EBITDA, % | 42.69 | 62.06 | 99.18 | 45.59 | 19.83 | 53.87 | 53.87 | 53.87 | 53.87 | 53.87 |
| Depreciation | 13.8 | 6.3 | 5.5 | 7.6 | 6.6 | 34.5 | 46.7 | 63.2 | 85.5 | 115.8 |
| Depreciation, % | 4.46 | 1.78 | 1.29 | 1.67 | 0.50259 | 1.94 | 1.94 | 1.94 | 1.94 | 1.94 |
| EBIT | 118.4 | 213.7 | 417.9 | 199.9 | 253.8 | 923.2 | 1,249.8 | 1,691.8 | 2,290.3 | 3,100.5 |
| EBIT, % | 38.23 | 60.28 | 97.89 | 43.92 | 19.33 | 51.93 | 51.93 | 51.93 | 51.93 | 51.93 |
| Total Cash | 1,940.1 | 1,383.8 | 1,930.9 | 2,994.3 | 2,525.4 | 1,777.7 | 2,406.6 | 3,257.9 | 4,410.3 | 5,970.4 |
| Total Cash, percent | .0 | .0 | .0 | .0 | .0 | .0 | .0 | .0 | .0 | .0 |
| Account Receivables | 6.7 | 5.4 | 5.2 | 8.0 | 11.1 | 26.7 | 36.1 | 48.9 | 66.2 | 89.6 |
| Account Receivables, % | 2.16 | 1.52 | 1.22 | 1.76 | 0.84526 | 1.5 | 1.5 | 1.5 | 1.5 | 1.5 |
| Inventories | -1,955.2 | .0 | -1,945.3 | -3,024.2 | .0 | -1,066.6 | -1,443.9 | -1,954.7 | -2,646.2 | -3,582.2 |
| Inventories, % | -631.32 | 0 | -455.68 | -664.51 | 0 | -60 | -60 | -60 | -60 | -60 |
| Accounts Payable | 45.1 | 33.1 | 55.9 | 189.8 | 226.7 | 341.2 | 461.9 | 625.3 | 846.4 | 1,145.9 |
| Accounts Payable, % | 14.56 | 9.34 | 13.09 | 41.71 | 17.26 | 19.19 | 19.19 | 19.19 | 19.19 | 19.19 |
| Capital Expenditure | -2.9 | -4.3 | -3.0 | -3.2 | -.9 | -12.9 | -17.4 | -23.6 | -32.0 | -43.3 |
| Capital Expenditure, % | -0.93639 | -1.21 | -0.70274 | -0.70314 | -0.06853488 | -0.72476 | -0.72476 | -0.72476 | -0.72476 | -0.72476 |
| Tax Rate, % | 26.71 | 26.71 | 26.71 | 26.71 | 26.71 | 26.71 | 26.71 | 26.71 | 26.71 | 26.71 |
| EBITAT | 91.3 | 164.5 | 313.6 | 153.9 | 186.0 | 700.5 | 948.3 | 1,283.8 | 1,737.9 | 2,352.7 |
| Depreciation | ||||||||||
| Changes in Account Receivables | ||||||||||
| Changes in Inventories | ||||||||||
| Changes in Accounts Payable | ||||||||||
| Capital Expenditure | ||||||||||
| UFCF | 2,095.8 | -1,799.4 | 2,284.4 | 1,368.3 | -2,798.7 | 1,887.6 | 1,466.1 | 1,984.7 | 2,686.8 | 3,637.2 |
| WACC, % | 29.17 | 29.13 | 28.55 | 29.13 | 28.03 | 28.8 | 28.8 | 28.8 | 28.8 | 28.8 |
| PV UFCF | ||||||||||
| SUM PV UFCF | 5,280.5 | |||||||||
| Long Term Growth Rate, % | 2.00 | |||||||||
| Free cash flow (T + 1) | 3,710 | |||||||||
| Terminal Value | 13,843 | |||||||||
| Present Terminal Value | 3,905 | |||||||||
| Enterprise Value | 9,186 | |||||||||
| Net Debt | -2,525 | |||||||||
| Equity Value | 11,711 | |||||||||
| Diluted Shares Outstanding, MM | 218 | |||||||||
| Equity Value Per Share | 5,362.20 |
What You Will Receive
- Flexible Forecast Inputs: Effortlessly adjust assumptions (growth %, margins, WACC) to explore various scenarios.
- Real-World Data: Paragon Banking Group PLC’s (PAGL) financial information pre-loaded to accelerate your analysis.
- Automated DCF Outputs: The template calculates Net Present Value (NPV) and intrinsic value automatically.
- Customizable and Professional: A refined Excel model tailored to suit your valuation requirements.
- Designed for Analysts and Investors: Perfect for evaluating projections, substantiating strategies, and streamlining your workflow.
Key Features
- Pre-Loaded Data: Historical financial statements and pre-filled forecasts for Paragon Banking Group PLC (PAGL).
- Fully Customizable Inputs: Adjust WACC, tax rates, revenue growth, and EBITDA margins to suit your analysis.
- Real-Time Results: Witness the recalculation of Paragon Banking Group PLC's (PAGL) intrinsic value instantly.
- Comprehensive Visual Outputs: Dashboard charts illustrate valuation results and essential metrics clearly.
- Engineered for Precision: A professional-grade tool designed for analysts, investors, and finance professionals.
How It Works
- Step 1: Download the Excel file for Paragon Banking Group PLC (PAGL).
- Step 2: Review the pre-filled financial data and forecasts for Paragon Banking Group PLC (PAGL).
- Step 3: Adjust key parameters such as revenue growth, WACC, and tax rates (highlighted cells).
- Step 4: Observe the DCF model refresh in real-time as you modify your assumptions.
- Step 5: Analyze the outputs and leverage the results for informed investment choices.
Why Choose This Calculator for Paragon Banking Group PLC (PAGL)?
- Precision: Leverages accurate financial data from Paragon Banking Group to ensure reliable results.
- Adaptability: Built to allow users to experiment with and adjust input variables effortlessly.
- Efficiency: Eliminate the complexities of constructing a DCF model from the ground up.
- Professional Quality: Crafted with insights and usability suitable for top-tier financial professionals.
- User-Centric: Intuitive interface makes it accessible for users with varying levels of financial expertise.
Who Can Benefit from Paragon Banking Group PLC (PAGL)?
- Institutional Investors: Develop comprehensive and dependable valuation models for investment portfolio analysis.
- Corporate Finance Departments: Examine valuation scenarios to inform internal strategic decisions.
- Financial Consultants and Advisors: Deliver precise valuation insights for Paragon Banking Group PLC (PAGL) to your clients.
- Students and Educators: Utilize real-time data to enhance learning and practical skills in financial modeling.
- Finance Enthusiasts: Gain insights into how banking institutions like Paragon Banking Group PLC (PAGL) are valued in the financial market.
Contents of the Template
- Comprehensive DCF Model: Editable template featuring extensive valuation calculations.
- Real-World Data: Historical and projected financials for Paragon Banking Group PLC (PAGL) included for analysis.
- Customizable Parameters: Modify WACC, growth rates, and tax assumptions to explore various scenarios.
- Financial Statements: Complete annual and quarterly breakdowns for enhanced insights.
- Key Ratios: Integrated analysis for profitability, operational efficiency, and leverage metrics.
- Dashboard with Visual Outputs: Charts and tables designed for clear and actionable insights.
Disclaimer
All information, articles, and product details provided on this website are for general informational and educational purposes only. We do not claim any ownership over, nor do we intend to infringe upon, any trademarks, copyrights, logos, brand names, or other intellectual property mentioned or depicted on this site. Such intellectual property remains the property of its respective owners, and any references here are made solely for identification or informational purposes, without implying any affiliation, endorsement, or partnership.
We make no representations or warranties, express or implied, regarding the accuracy, completeness, or suitability of any content or products presented. Nothing on this website should be construed as legal, tax, investment, financial, medical, or other professional advice. In addition, no part of this site—including articles or product references—constitutes a solicitation, recommendation, endorsement, advertisement, or offer to buy or sell any securities, franchises, or other financial instruments, particularly in jurisdictions where such activity would be unlawful.
All content is of a general nature and may not address the specific circumstances of any individual or entity. It is not a substitute for professional advice or services. Any actions you take based on the information provided here are strictly at your own risk. You accept full responsibility for any decisions or outcomes arising from your use of this website and agree to release us from any liability in connection with your use of, or reliance upon, the content or products found herein.