
|
Pitney Bowes Inc. (PBI) Valation DCF |
Entièrement Modifiable: Adapté À Vos Besoins Dans Excel Ou Sheets
Conception Professionnelle: Modèles Fiables Et Conformes Aux Normes Du Secteur
Pré-Construits Pour Une Utilisation Rapide Et Efficace
Compatible MAC/PC, entièrement débloqué
Aucune Expertise N'Est Requise; Facile À Suivre
Pitney Bowes Inc. (PBI) Bundle
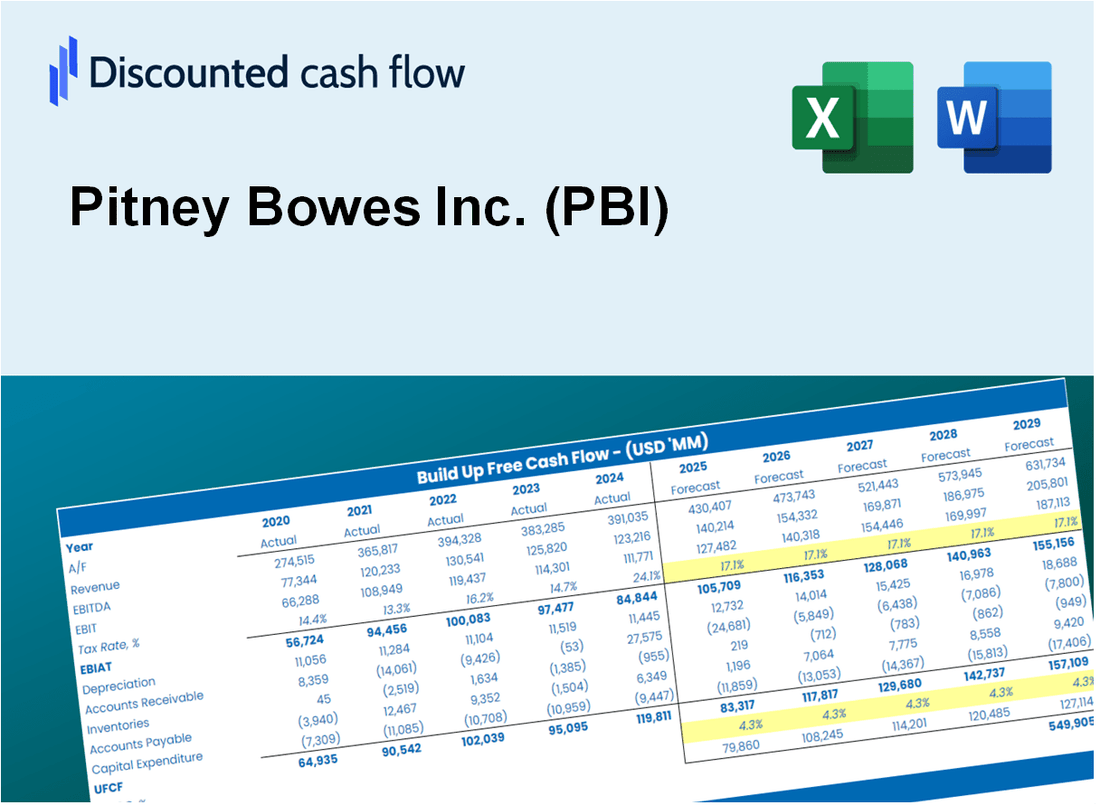
Gardez un aperçu de votre analyse d'évaluation de votre Pitney Bowes Inc. (PBI) à l'aide de notre puissante calculatrice DCF! Équipé de données à jour pour (PBI), ce modèle Excel vous permet d'ajuster les prévisions et les hypothèses pour déterminer avec précision la valeur intrinsèque de Pitney Bowes Inc.
Discounted Cash Flow (DCF) - (USD MM)
| Year | AY1 2020 |
AY2 2021 |
AY3 2022 |
AY4 2023 |
AY5 2024 |
FY1 2025 |
FY2 2026 |
FY3 2027 |
FY4 2028 |
FY5 2029 |
|---|---|---|---|---|---|---|---|---|---|---|
| Revenue | 3,554.1 | 3,673.6 | 3,538.0 | 3,266.3 | 2,026.6 | 1,793.7 | 1,587.6 | 1,405.2 | 1,243.7 | 1,100.8 |
| Revenue Growth, % | 0 | 3.36 | -3.69 | -7.68 | -37.96 | -11.49 | -11.49 | -11.49 | -11.49 | -11.49 |
| EBITDA | 83.0 | 312.9 | 294.2 | 230.9 | 172.3 | 124.6 | 110.3 | 97.6 | 86.4 | 76.5 |
| EBITDA, % | 2.34 | 8.52 | 8.32 | 7.07 | 8.5 | 6.95 | 6.95 | 6.95 | 6.95 | 6.95 |
| Depreciation | 160.6 | 162.9 | 163.8 | 160.4 | 114.5 | 86.6 | 76.7 | 67.9 | 60.1 | 53.2 |
| Depreciation, % | 4.52 | 4.43 | 4.63 | 4.91 | 5.65 | 4.83 | 4.83 | 4.83 | 4.83 | 4.83 |
| EBIT | -77.6 | 150.0 | 130.4 | 70.4 | 57.8 | 38.0 | 33.6 | 29.8 | 26.4 | 23.3 |
| EBIT, % | -2.18 | 4.08 | 3.69 | 2.16 | 2.85 | 2.12 | 2.12 | 2.12 | 2.12 | 2.12 |
| Total Cash | 940.4 | 746.9 | 681.2 | 623.2 | 486.1 | 391.4 | 346.5 | 306.6 | 271.4 | 240.2 |
| Total Cash, percent | .0 | .0 | .0 | .0 | .0 | .0 | .0 | .0 | .0 | .0 |
| Account Receivables | 980.5 | 909.2 | 917.3 | 906.3 | 706.0 | 505.3 | 447.2 | 395.8 | 350.4 | 310.1 |
| Account Receivables, % | 27.59 | 24.75 | 25.93 | 27.75 | 34.84 | 28.17 | 28.17 | 28.17 | 28.17 | 28.17 |
| Inventories | 71.5 | 78.6 | 83.7 | 70.1 | 59.8 | 41.7 | 36.9 | 32.6 | 28.9 | 25.6 |
| Inventories, % | 2.01 | 2.14 | 2.37 | 2.14 | 2.95 | 2.32 | 2.32 | 2.32 | 2.32 | 2.32 |
| Accounts Payable | 295.2 | 311.0 | 315.4 | 282.4 | 239.7 | 165.6 | 146.6 | 129.7 | 114.8 | 101.6 |
| Accounts Payable, % | 8.31 | 8.47 | 8.91 | 8.65 | 11.83 | 9.23 | 9.23 | 9.23 | 9.23 | 9.23 |
| Capital Expenditure | -105.0 | -184.0 | -124.8 | -102.9 | -72.4 | -65.3 | -57.8 | -51.2 | -45.3 | -40.1 |
| Capital Expenditure, % | -2.95 | -5.01 | -3.53 | -3.15 | -3.57 | -3.64 | -3.64 | -3.64 | -3.64 | -3.64 |
| Tax Rate, % | -289.09 | -289.09 | -289.09 | -289.09 | -289.09 | -289.09 | -289.09 | -289.09 | -289.09 | -289.09 |
| EBITAT | -76.3 | -71.0 | 120.8 | 66.8 | 224.8 | 29.3 | 26.0 | 23.0 | 20.3 | 18.0 |
| Depreciation | ||||||||||
| Changes in Account Receivables | ||||||||||
| Changes in Inventories | ||||||||||
| Changes in Accounts Payable | ||||||||||
| Capital Expenditure | ||||||||||
| UFCF | -777.5 | -12.1 | 150.9 | 116.1 | 434.7 | 195.3 | 88.6 | 78.4 | 69.4 | 61.4 |
| WACC, % | 7.33 | 4.52 | 7.17 | 7.23 | 7.38 | 6.72 | 6.72 | 6.72 | 6.72 | 6.72 |
| PV UFCF | ||||||||||
| SUM PV UFCF | 423.2 | |||||||||
| Long Term Growth Rate, % | 3.50 | |||||||||
| Free cash flow (T + 1) | 64 | |||||||||
| Terminal Value | 1,972 | |||||||||
| Present Terminal Value | 1,424 | |||||||||
| Enterprise Value | 1,847 | |||||||||
| Net Debt | 1,578 | |||||||||
| Equity Value | 270 | |||||||||
| Diluted Shares Outstanding, MM | 183 | |||||||||
| Equity Value Per Share | 1.48 |
What You Will Get
- Editable Excel Template: A fully customizable Excel-based DCF Calculator featuring pre-filled real PBI financials.
- Real-World Data: Historical data and forward-looking estimates (highlighted in the yellow cells).
- Forecast Flexibility: Adjust forecast assumptions such as revenue growth, EBITDA %, and WACC.
- Automatic Calculations: Instantly observe how your inputs affect Pitney Bowes' valuation.
- Professional Tool: Designed for investors, CFOs, consultants, and financial analysts.
- User-Friendly Design: Organized for clarity and ease of use, complete with step-by-step instructions.
Key Features
- Comprehensive PBI Data: Pre-loaded with Pitney Bowes’ historical financial performance and future projections.
- Flexible Input Options: Modify revenue growth rates, profit margins, WACC, tax rates, and capital expenditures as needed.
- Adaptive Valuation Model: Real-time updates to Net Present Value (NPV) and intrinsic value based on user inputs.
- Scenario Analysis: Develop various forecasting scenarios to evaluate different valuation possibilities.
- Intuitive User Interface: Designed to be straightforward and accessible for both seasoned professionals and newcomers.
How It Works
- Download the Template: Gain immediate access to the Excel-based PBI DCF Calculator.
- Input Your Assumptions: Modify the yellow-highlighted cells for growth rates, WACC, margins, and additional factors.
- Instant Calculations: The model automatically recalculates Pitney Bowes' intrinsic value.
- Test Scenarios: Experiment with various assumptions to assess potential changes in valuation.
- Analyze and Decide: Utilize the results to inform your investment or financial analysis.
Why Choose Pitney Bowes Inc. (PBI)?
- Streamlined Operations: Leverage our solutions to enhance efficiency without starting from scratch.
- Enhanced Precision: Utilize accurate data and methodologies to minimize errors in logistics and shipping.
- Completely Adaptable: Customize our services to align with your specific business needs and goals.
- User-Friendly Interface: Intuitive dashboards and reports make insights easily accessible.
- Preferred by Industry Leaders: Our solutions are trusted by professionals who prioritize accuracy and functionality.
Who Should Use This Product?
- Professional Investors: Develop comprehensive and accurate valuation models for analyzing Pitney Bowes Inc. (PBI) investments.
- Corporate Finance Teams: Evaluate valuation scenarios to inform strategic decisions within the organization.
- Consultants and Advisors: Deliver precise valuation insights to clients considering Pitney Bowes Inc. (PBI) stock.
- Students and Educators: Utilize real-world data to enhance learning and practice in financial modeling related to Pitney Bowes Inc. (PBI).
- Tech Enthusiasts: Gain insights into the valuation of technology companies like Pitney Bowes Inc. (PBI) in the financial market.
What the Template Contains
- Comprehensive DCF Model: Editable template with detailed valuation calculations tailored for Pitney Bowes Inc. (PBI).
- Real-World Data: Pitney Bowes Inc.’s historical and projected financials preloaded for analysis.
- Customizable Parameters: Adjust WACC, growth rates, and tax assumptions to explore various scenarios.
- Financial Statements: Complete annual and quarterly breakdowns for enhanced insights.
- Key Ratios: Built-in analysis for profitability, efficiency, and leverage specific to Pitney Bowes Inc. (PBI).
- Dashboard with Visual Outputs: Charts and tables designed for clear, actionable results.
Disclaimer
All information, articles, and product details provided on this website are for general informational and educational purposes only. We do not claim any ownership over, nor do we intend to infringe upon, any trademarks, copyrights, logos, brand names, or other intellectual property mentioned or depicted on this site. Such intellectual property remains the property of its respective owners, and any references here are made solely for identification or informational purposes, without implying any affiliation, endorsement, or partnership.
We make no representations or warranties, express or implied, regarding the accuracy, completeness, or suitability of any content or products presented. Nothing on this website should be construed as legal, tax, investment, financial, medical, or other professional advice. In addition, no part of this site—including articles or product references—constitutes a solicitation, recommendation, endorsement, advertisement, or offer to buy or sell any securities, franchises, or other financial instruments, particularly in jurisdictions where such activity would be unlawful.
All content is of a general nature and may not address the specific circumstances of any individual or entity. It is not a substitute for professional advice or services. Any actions you take based on the information provided here are strictly at your own risk. You accept full responsibility for any decisions or outcomes arising from your use of this website and agree to release us from any liability in connection with your use of, or reliance upon, the content or products found herein.