
|
PC Jeweler Limited (Pcjeweller.NS) Valation DCF |
Entièrement Modifiable: Adapté À Vos Besoins Dans Excel Ou Sheets
Conception Professionnelle: Modèles Fiables Et Conformes Aux Normes Du Secteur
Pré-Construits Pour Une Utilisation Rapide Et Efficace
Compatible MAC/PC, entièrement débloqué
Aucune Expertise N'Est Requise; Facile À Suivre
PC Jeweller Limited (PCJEWELLER.NS) Bundle
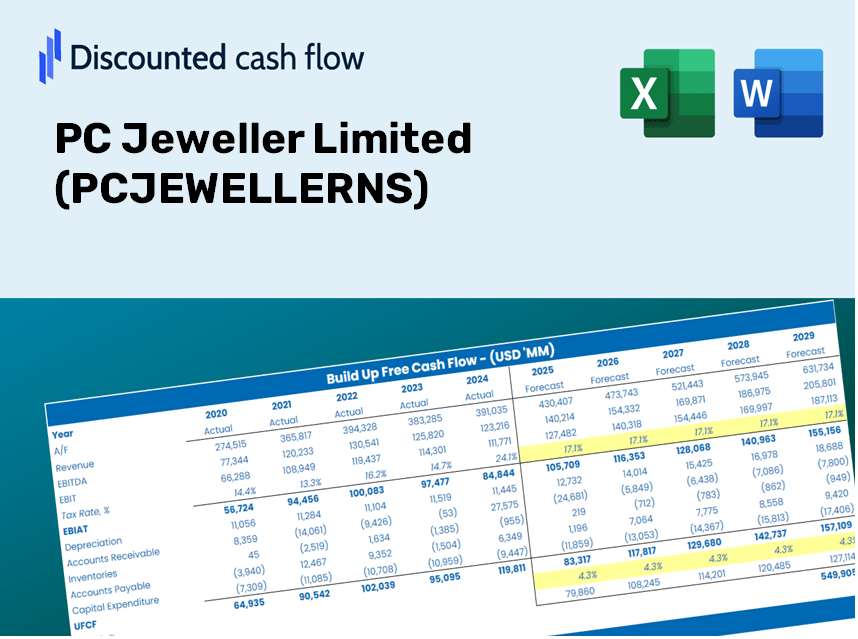
Améliorez vos stratégies d'investissement avec la calculatrice DCF LIMITED (PCJewellerns)! Explorez des données financières authentiques de PC Jeweler, ajustez les projections et dépenses de croissance et observez instantanément comment ces modifications affectent la valeur intrinsèque du bijoutier PC.
Discounted Cash Flow (DCF) - (USD MM)
| Year | AY1 2021 |
AY2 2022 |
AY3 2023 |
AY4 2024 |
AY5 2025 |
FY1 2026 |
FY2 2027 |
FY3 2028 |
FY4 2029 |
FY5 2030 |
|---|---|---|---|---|---|---|---|---|---|---|
| Revenue | 28,263.4 | 16,061.3 | 24,726.8 | 6,054.0 | 22,446.0 | 26,460.7 | 31,193.5 | 36,772.9 | 43,350.1 | 51,103.8 |
| Revenue Growth, % | 0 | -43.17 | 53.95 | -75.52 | 270.76 | 17.89 | 17.89 | 17.89 | 17.89 | 17.89 |
| EBITDA | 4,252.9 | -479.7 | 4,091.4 | -1,162.9 | 5,218.0 | 1,727.6 | 2,036.6 | 2,400.9 | 2,830.3 | 3,336.6 |
| EBITDA, % | 15.05 | -2.99 | 16.55 | -19.21 | 23.25 | 6.53 | 6.53 | 6.53 | 6.53 | 6.53 |
| Depreciation | 349.3 | 277.5 | 272.3 | 203.7 | 179.5 | 435.5 | 513.4 | 605.2 | 713.5 | 841.1 |
| Depreciation, % | 1.24 | 1.73 | 1.1 | 3.36 | 0.7997 | 1.65 | 1.65 | 1.65 | 1.65 | 1.65 |
| EBIT | 3,903.6 | -757.2 | 3,819.1 | -1,366.6 | 5,038.5 | 1,292.1 | 1,523.2 | 1,795.7 | 2,116.9 | 2,495.5 |
| EBIT, % | 13.81 | -4.71 | 15.45 | -22.57 | 22.45 | 4.88 | 4.88 | 4.88 | 4.88 | 4.88 |
| Total Cash | 1,009.8 | 628.5 | 500.8 | 73.4 | 637.8 | 717.9 | 846.3 | 997.7 | 1,176.1 | 1,386.5 |
| Total Cash, percent | .0 | .0 | .0 | .0 | .0 | .0 | .0 | .0 | .0 | .0 |
| Account Receivables | 14,482.9 | 2,851.9 | 4,311.9 | 1,827.5 | 3,510.9 | 6,999.7 | 8,251.6 | 9,727.5 | 11,467.4 | 13,518.5 |
| Account Receivables, % | 51.24 | 17.76 | 17.44 | 30.19 | 15.64 | 26.45 | 26.45 | 26.45 | 26.45 | 26.45 |
| Inventories | 59,442.9 | 56,667.6 | 57,906.3 | 56,328.1 | 66,491.5 | 26,460.7 | 31,193.5 | 36,772.9 | 43,350.1 | 51,103.8 |
| Inventories, % | 210.32 | 352.82 | 234.18 | 930.43 | 296.23 | 100 | 100 | 100 | 100 | 100 |
| Accounts Payable | 9,373.5 | 163.7 | 173.9 | 138.3 | 137.7 | 1,999.6 | 2,357.3 | 2,778.9 | 3,276.0 | 3,861.9 |
| Accounts Payable, % | 33.16 | 1.02 | 0.70329 | 2.28 | 0.61347 | 7.56 | 7.56 | 7.56 | 7.56 | 7.56 |
| Capital Expenditure | -6.9 | -37.1 | -23.7 | -1.3 | -5.7 | -21.1 | -24.8 | -29.3 | -34.5 | -40.7 |
| Capital Expenditure, % | -0.0244132 | -0.23099 | -0.09584742 | -0.02147341 | -0.02539428 | -0.07962366 | -0.07962366 | -0.07962366 | -0.07962366 | -0.07962366 |
| Tax Rate, % | -27.65 | -27.65 | -27.65 | -27.65 | -27.65 | -27.65 | -27.65 | -27.65 | -27.65 | -27.65 |
| EBITAT | 30,988.9 | -582.8 | 7,190.2 | -1,361.4 | 6,431.7 | 1,231.6 | 1,451.9 | 1,711.6 | 2,017.7 | 2,378.6 |
| Depreciation | ||||||||||
| Changes in Account Receivables | ||||||||||
| Changes in Inventories | ||||||||||
| Changes in Accounts Payable | ||||||||||
| Capital Expenditure | ||||||||||
| UFCF | -33,221.0 | 4,854.1 | 4,750.3 | 2,868.0 | -5,241.9 | 40,050.0 | -3,686.7 | -4,346.1 | -5,123.4 | -6,039.8 |
| WACC, % | 4.6 | 4.39 | 4.6 | 4.59 | 4.6 | 4.56 | 4.56 | 4.56 | 4.56 | 4.56 |
| PV UFCF | ||||||||||
| SUM PV UFCF | 22,009.3 | |||||||||
| Long Term Growth Rate, % | 3.50 | |||||||||
| Free cash flow (T + 1) | -6,251 | |||||||||
| Terminal Value | -592,291 | |||||||||
| Present Terminal Value | -474,027 | |||||||||
| Enterprise Value | -452,017 | |||||||||
| Net Debt | 20,873 | |||||||||
| Equity Value | -472,890 | |||||||||
| Diluted Shares Outstanding, MM | 5,102 | |||||||||
| Equity Value Per Share | -92.69 |
What You Can Expect
- Adjustable Forecast Inputs: Easily modify assumptions (growth %, profit margins, WACC) to explore various scenarios.
- Comprehensive Data: PC Jeweller's financial information pre-loaded to facilitate your analysis.
- Instant DCF Outputs: The template automatically calculates Net Present Value (NPV) and intrinsic value for your convenience.
- Customizable and Professional Design: A sleek Excel model tailored to meet your valuation requirements.
- Designed for Analysts and Investors: Perfect for assessing projections, validating strategies, and enhancing efficiency.
Key Features
- Comprehensive DCF Calculator: Features detailed unlevered and levered DCF valuation models tailored for PC Jeweller Limited (PCJEWELLERNS).
- WACC Calculator: Includes a pre-configured Weighted Average Cost of Capital sheet with adjustable inputs suitable for the jewelry industry.
- Customizable Forecast Assumptions: Easily modify growth projections, capital expenditures, and discount rates specific to PC Jeweller Limited (PCJEWELLERNS).
- Integrated Financial Ratios: Evaluate profitability, leverage, and efficiency metrics relevant to PC Jeweller Limited (PCJEWELLERNS).
- Interactive Dashboard and Charts: Visual representations that highlight key valuation metrics for straightforward analysis.
How It Operates
- Download the Template: Gain immediate access to the Excel-based PCJEWELLERNS DCF Calculator.
- Input Your Assumptions: Modify the yellow-highlighted cells for growth rates, WACC, margins, and other parameters.
- Instant Calculations: The model will automatically calculate the intrinsic value of PC Jeweller Limited.
- Test Scenarios: Experiment with various assumptions to see how they affect the valuation.
- Analyze and Decide: Leverage the insights gained from the results to inform your investment or financial decisions.
Why Opt for This Calculator?
- All-in-One Solution: Offers DCF, WACC, and financial ratio analyses seamlessly integrated.
- Flexible Input Options: Modify the yellow-highlighted cells to explore different scenarios.
- In-Depth Analysis: Automatically calculates the intrinsic value and Net Present Value for PC Jeweller Limited (PCJEWELLERNS).
- Preloaded Information: Historical and forecasted data provide reliable starting points for calculations.
- High Professional Standard: Perfect for financial analysts, investors, and business consultants.
Who Can Benefit from This Product?
- Finance Students: Master valuation methods and apply them using real-world data.
- Academics: Integrate industry-standard models into your courses or research projects.
- Investors: Challenge your assumptions and assess valuation scenarios for PC Jeweller Limited (PCJEWELLERNS) stock.
- Analysts: Enhance your efficiency with a ready-to-use, customizable DCF model.
- Small Business Owners: Understand the analytical approaches used for evaluating large public companies like PC Jeweller Limited (PCJEWELLERNS).
Contents of the Template
- Historical Data: Contains PC Jeweller's previous financial performance and foundational forecasts.
- DCF and Levered DCF Models: Comprehensive templates for assessing PC Jeweller's intrinsic value.
- WACC Sheet: Preconfigured calculations for the Weighted Average Cost of Capital.
- Editable Inputs: Customize essential drivers such as growth rates, EBITDA percentages, and CAPEX estimates.
- Quarterly and Annual Statements: A detailed overview of PC Jeweller's financial metrics.
- Interactive Dashboard: Dynamically visualize valuation outcomes and future projections.
Disclaimer
All information, articles, and product details provided on this website are for general informational and educational purposes only. We do not claim any ownership over, nor do we intend to infringe upon, any trademarks, copyrights, logos, brand names, or other intellectual property mentioned or depicted on this site. Such intellectual property remains the property of its respective owners, and any references here are made solely for identification or informational purposes, without implying any affiliation, endorsement, or partnership.
We make no representations or warranties, express or implied, regarding the accuracy, completeness, or suitability of any content or products presented. Nothing on this website should be construed as legal, tax, investment, financial, medical, or other professional advice. In addition, no part of this site—including articles or product references—constitutes a solicitation, recommendation, endorsement, advertisement, or offer to buy or sell any securities, franchises, or other financial instruments, particularly in jurisdictions where such activity would be unlawful.
All content is of a general nature and may not address the specific circumstances of any individual or entity. It is not a substitute for professional advice or services. Any actions you take based on the information provided here are strictly at your own risk. You accept full responsibility for any decisions or outcomes arising from your use of this website and agree to release us from any liability in connection with your use of, or reliance upon, the content or products found herein.