
|
Procore Technologies, Inc. (PCOR) Évaluation DCF |
Entièrement Modifiable: Adapté À Vos Besoins Dans Excel Ou Sheets
Conception Professionnelle: Modèles Fiables Et Conformes Aux Normes Du Secteur
Pré-Construits Pour Une Utilisation Rapide Et Efficace
Compatible MAC/PC, entièrement débloqué
Aucune Expertise N'Est Requise; Facile À Suivre
Procore Technologies, Inc. (PCOR) Bundle
Streamline Procore Technologies, Inc. (PCOR) Évaluation avec cette calculatrice DCF personnalisable! Équipés de Real Procore Technologies, Inc. (PCOR) Financials et des entrées de prévision réglables, vous pouvez explorer différents scénarios et déterminer la juste valeur de Procore Technologies, Inc. (PCOR) en quelques minutes.
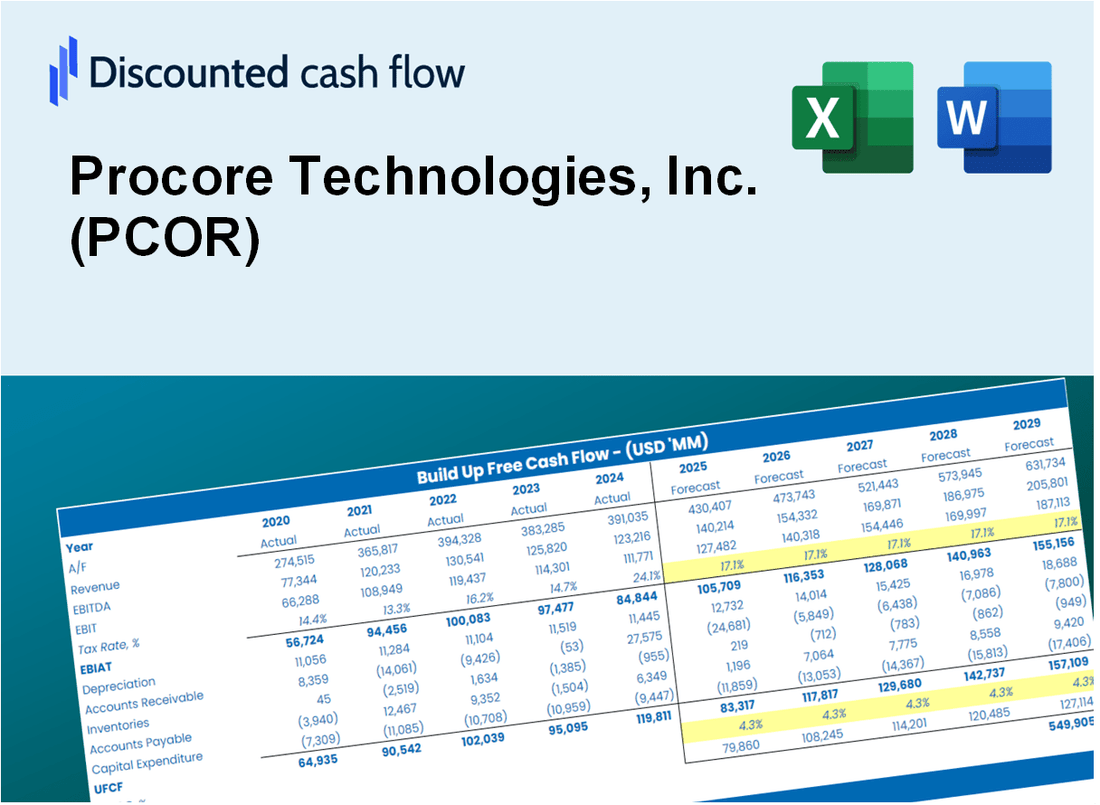
Discounted Cash Flow (DCF) - (USD MM)
| Year | AY1 2020 |
AY2 2021 |
AY3 2022 |
AY4 2023 |
AY5 2024 |
FY1 2025 |
FY2 2026 |
FY3 2027 |
FY4 2028 |
FY5 2029 |
|---|---|---|---|---|---|---|---|---|---|---|
| Revenue | 400.3 | 514.8 | 720.2 | 950.0 | 1,151.7 | 1,502.0 | 1,958.7 | 2,554.4 | 3,331.2 | 4,344.3 |
| Revenue Growth, % | 0 | 28.61 | 39.89 | 31.91 | 21.23 | 30.41 | 30.41 | 30.41 | 30.41 | 30.41 |
| EBITDA | -68.8 | -250.2 | -221.3 | -114.8 | -12.5 | -329.5 | -429.7 | -560.4 | -730.8 | -953.1 |
| EBITDA, % | -17.19 | -48.6 | -30.73 | -12.09 | -1.09 | -21.94 | -21.94 | -21.94 | -21.94 | -21.94 |
| Depreciation | 26.0 | 36.4 | 63.0 | 71.6 | 89.8 | 113.1 | 147.5 | 192.3 | 250.8 | 327.1 |
| Depreciation, % | 6.49 | 7.07 | 8.75 | 7.54 | 7.79 | 7.53 | 7.53 | 7.53 | 7.53 | 7.53 |
| EBIT | -94.8 | -286.6 | -284.3 | -186.5 | -102.3 | -442.6 | -577.2 | -752.7 | -981.7 | -1,280.2 |
| EBIT, % | -23.68 | -55.67 | -39.48 | -19.63 | -8.88 | -29.47 | -29.47 | -29.47 | -29.47 | -29.47 |
| Total Cash | 379.9 | 586.1 | 582.2 | 678.0 | 775.4 | 1,244.9 | 1,623.5 | 2,117.3 | 2,761.2 | 3,600.9 |
| Total Cash, percent | .0 | .0 | .0 | .0 | .0 | .0 | .0 | .0 | .0 | .0 |
| Account Receivables | 77.7 | 131.0 | 172.3 | 237.3 | 280.4 | 354.8 | 462.6 | 603.3 | 786.8 | 1,026.1 |
| Account Receivables, % | 19.41 | 25.45 | 23.92 | 24.97 | 24.35 | 23.62 | 23.62 | 23.62 | 23.62 | 23.62 |
| Inventories | .0 | .0 | .0 | .0 | .0 | .0 | .0 | .0 | .0 | .0 |
| Inventories, % | 0 | 0 | 0 | 0 | 0 | 0 | 0 | 0 | 0 | 0 |
| Accounts Payable | 9.0 | 15.5 | 14.3 | 13.2 | 33.1 | 34.6 | 45.1 | 58.8 | 76.7 | 100.0 |
| Accounts Payable, % | 2.25 | 3.01 | 1.98 | 1.39 | 2.88 | 2.3 | 2.3 | 2.3 | 2.3 | 2.3 |
| Capital Expenditure | -19.0 | -27.6 | -49.4 | -45.0 | -19.1 | -70.2 | -91.5 | -119.4 | -155.7 | -203.0 |
| Capital Expenditure, % | -4.74 | -5.37 | -6.86 | -4.74 | -1.66 | -4.67 | -4.67 | -4.67 | -4.67 | -4.67 |
| Tax Rate, % | -1.7 | -1.7 | -1.7 | -1.7 | -1.7 | -1.7 | -1.7 | -1.7 | -1.7 | -1.7 |
| EBITAT | -93.8 | -263.0 | -284.8 | -187.7 | -104.0 | -434.4 | -566.5 | -738.8 | -963.5 | -1,256.5 |
| Depreciation | ||||||||||
| Changes in Account Receivables | ||||||||||
| Changes in Inventories | ||||||||||
| Changes in Accounts Payable | ||||||||||
| Capital Expenditure | ||||||||||
| UFCF | -155.5 | -301.1 | -313.7 | -227.2 | -56.6 | -464.5 | -608.0 | -792.9 | -1,034.0 | -1,348.4 |
| WACC, % | 7.98 | 7.97 | 7.98 | 7.98 | 7.98 | 7.98 | 7.98 | 7.98 | 7.98 | 7.98 |
| PV UFCF | ||||||||||
| SUM PV UFCF | -3,260.9 | |||||||||
| Long Term Growth Rate, % | 2.00 | |||||||||
| Free cash flow (T + 1) | -1,375 | |||||||||
| Terminal Value | -23,016 | |||||||||
| Present Terminal Value | -15,682 | |||||||||
| Enterprise Value | -18,942 | |||||||||
| Net Debt | -358 | |||||||||
| Equity Value | -18,585 | |||||||||
| Diluted Shares Outstanding, MM | 147 | |||||||||
| Equity Value Per Share | -126.05 |
What You Will Get
- Pre-Filled Financial Model: Procore Technologies’ actual data facilitates accurate DCF valuation.
- Full Forecast Control: Modify revenue growth, margins, WACC, and other essential drivers.
- Instant Calculations: Automatic updates provide real-time results as you make adjustments.
- Investor-Ready Template: A polished Excel file crafted for professional-level valuation.
- Customizable and Reusable: Designed for flexibility, enabling repeated use for comprehensive forecasts.
Key Features
- Customizable Project Metrics: Adjust essential inputs such as project timelines, budget allocations, and resource management.
- Instant Project Insights: Provides real-time analytics and performance metrics for informed decision-making.
- Industry-Leading Precision: Leverages Procore's extensive data for accurate project forecasting and reporting.
- Effortless Collaboration: Streamlines communication and document sharing among project stakeholders.
- Efficiency Booster: Reduces the need for cumbersome spreadsheets and manual tracking processes.
How It Works
- Download the Template: Gain immediate access to the Excel-based PCOR DCF Calculator.
- Input Your Assumptions: Modify the yellow-highlighted cells for growth rates, WACC, margins, and more.
- Instant Calculations: The model automatically recalculates Procore’s intrinsic value.
- Test Scenarios: Experiment with different assumptions to assess potential valuation shifts.
- Analyze and Decide: Utilize the results to inform your investment or financial strategy.
Why Choose Procore's Solutions?
- Reliability: Proven track record in enhancing construction project efficiency.
- Customization: Tailored tools that adapt to your specific project needs.
- Efficiency: Streamline workflows to save time and reduce project delays.
- Industry Expertise: Built with insights from construction professionals and experts.
- Intuitive Interface: User-friendly design that simplifies project management for all skill levels.
Who Should Use This Product?
- Investors: Evaluate Procore’s valuation before making stock trades.
- CFOs and Financial Analysts: Optimize valuation workflows and assess financial forecasts.
- Startup Founders: Understand the valuation methods used for leading tech companies like Procore.
- Consultants: Provide comprehensive valuation reports to clients leveraging Procore’s data.
- Students and Educators: Utilize real-time data to learn and teach valuation strategies.
What the Template Contains
- Pre-Filled DCF Model: Procore Technologies' financial data preloaded for immediate use.
- WACC Calculator: Detailed calculations for Weighted Average Cost of Capital.
- Financial Ratios: Evaluate Procore's profitability, leverage, and efficiency.
- Editable Inputs: Change assumptions such as growth, margins, and CAPEX to fit your scenarios.
- Financial Statements: Annual and quarterly reports to support detailed analysis.
- Interactive Dashboard: Easily visualize key valuation metrics and results.
Disclaimer
All information, articles, and product details provided on this website are for general informational and educational purposes only. We do not claim any ownership over, nor do we intend to infringe upon, any trademarks, copyrights, logos, brand names, or other intellectual property mentioned or depicted on this site. Such intellectual property remains the property of its respective owners, and any references here are made solely for identification or informational purposes, without implying any affiliation, endorsement, or partnership.
We make no representations or warranties, express or implied, regarding the accuracy, completeness, or suitability of any content or products presented. Nothing on this website should be construed as legal, tax, investment, financial, medical, or other professional advice. In addition, no part of this site—including articles or product references—constitutes a solicitation, recommendation, endorsement, advertisement, or offer to buy or sell any securities, franchises, or other financial instruments, particularly in jurisdictions where such activity would be unlawful.
All content is of a general nature and may not address the specific circumstances of any individual or entity. It is not a substitute for professional advice or services. Any actions you take based on the information provided here are strictly at your own risk. You accept full responsibility for any decisions or outcomes arising from your use of this website and agree to release us from any liability in connection with your use of, or reliance upon, the content or products found herein.