
|
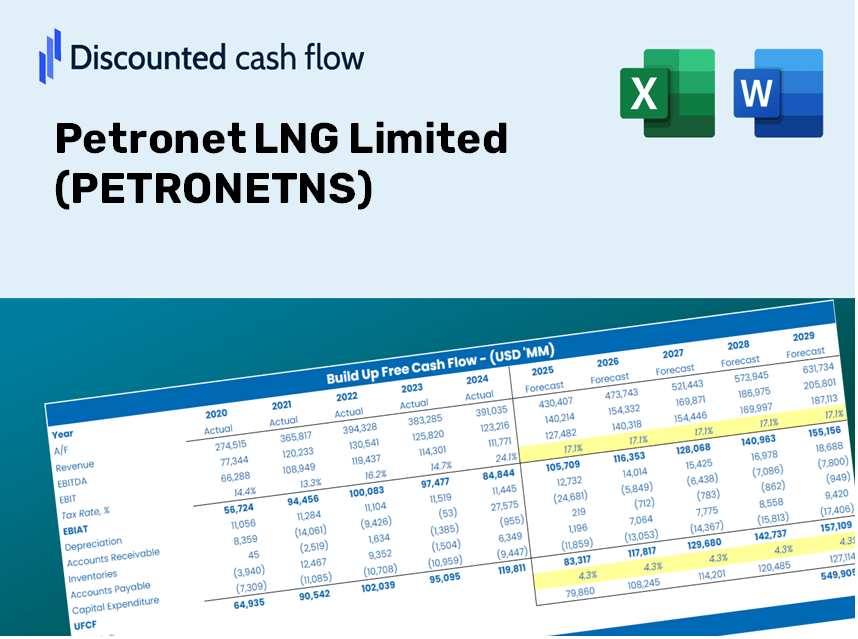
Petronet LNG Limited (Petronet.NS) évaluation DCF |
Entièrement Modifiable: Adapté À Vos Besoins Dans Excel Ou Sheets
Conception Professionnelle: Modèles Fiables Et Conformes Aux Normes Du Secteur
Pré-Construits Pour Une Utilisation Rapide Et Efficace
Compatible MAC/PC, entièrement débloqué
Aucune Expertise N'Est Requise; Facile À Suivre
Petronet LNG Limited (PETRONET.NS) Bundle
Vous cherchez à évaluer la valeur intrinsèque de Petronet LNG Limited? Notre calculatrice de Petronetns DCF intègre des données réelles avec des fonctionnalités de personnalisation étendues, vous permettant d'affiner vos prévisions et d'améliorer vos choix d'investissement.
Discounted Cash Flow (DCF) - (USD MM)
| Year | AY1 2021 |
AY2 2022 |
AY3 2023 |
AY4 2024 |
AY5 2025 |
FY1 2026 |
FY2 2027 |
FY3 2028 |
FY4 2029 |
FY5 2030 |
|---|---|---|---|---|---|---|---|---|---|---|
| Revenue | 260,229.0 | 431,685.7 | 598,993.6 | 527,293.3 | 509,820.3 | 486,205.2 | 463,683.9 | 442,205.9 | 421,722.7 | 402,188.3 |
| Revenue Growth, % | 0 | 65.89 | 38.76 | -11.97 | -3.31 | -4.63 | -4.63 | -4.63 | -4.63 | -4.63 |
| EBITDA | 43,608.6 | 50,072.1 | 47,749.8 | 49,164.8 | 52,556.6 | 54,417.5 | 51,896.9 | 49,493.0 | 47,200.5 | 45,014.1 |
| EBITDA, % | 16.76 | 11.6 | 7.97 | 9.32 | 10.31 | 11.19 | 11.19 | 11.19 | 11.19 | 11.19 |
| Depreciation | 4,318.0 | 4,309.6 | 4,295.9 | 4,419.6 | 4,780.8 | 5,008.6 | 4,776.6 | 4,555.4 | 4,344.4 | 4,143.1 |
| Depreciation, % | 1.66 | 0.99832 | 0.71719 | 0.83817 | 0.93774 | 1.03 | 1.03 | 1.03 | 1.03 | 1.03 |
| EBIT | 39,290.6 | 45,762.5 | 43,453.9 | 44,745.2 | 47,775.8 | 49,408.9 | 47,120.3 | 44,937.6 | 42,856.1 | 40,871.0 |
| EBIT, % | 15.1 | 10.6 | 7.25 | 8.49 | 9.37 | 10.16 | 10.16 | 10.16 | 10.16 | 10.16 |
| Total Cash | 57,075.2 | 51,574.6 | 65,005.7 | 73,288.7 | 101,463.3 | 76,366.6 | 72,829.2 | 69,455.7 | 66,238.5 | 63,170.3 |
| Total Cash, percent | .0 | .0 | .0 | .0 | .0 | .0 | .0 | .0 | .0 | .0 |
| Account Receivables | 20,743.4 | 29,052.9 | 41,056.6 | 37,666.3 | 32,668.9 | 34,138.2 | 32,556.9 | 31,048.9 | 29,610.7 | 28,239.1 |
| Account Receivables, % | 7.97 | 6.73 | 6.85 | 7.14 | 6.41 | 7.02 | 7.02 | 7.02 | 7.02 | 7.02 |
| Inventories | 3,371.8 | 5,766.8 | 11,530.5 | 14,654.4 | 12,044.2 | 9,430.6 | 8,993.8 | 8,577.2 | 8,179.9 | 7,801.0 |
| Inventories, % | 1.3 | 1.34 | 1.92 | 2.78 | 2.36 | 1.94 | 1.94 | 1.94 | 1.94 | 1.94 |
| Accounts Payable | 5,678.4 | 7,935.4 | 9,802.2 | 28,761.0 | 25,630.4 | 15,693.3 | 14,966.4 | 14,273.1 | 13,612.0 | 12,981.5 |
| Accounts Payable, % | 2.18 | 1.84 | 1.64 | 5.45 | 5.03 | 3.23 | 3.23 | 3.23 | 3.23 | 3.23 |
| Capital Expenditure | -730.4 | -723.2 | -10,577.1 | -8,412.9 | -14,517.8 | -6,473.5 | -6,173.6 | -5,887.6 | -5,614.9 | -5,354.8 |
| Capital Expenditure, % | -0.28068 | -0.16753 | -1.77 | -1.6 | -2.85 | -1.33 | -1.33 | -1.33 | -1.33 | -1.33 |
| Tax Rate, % | 25.35 | 25.35 | 25.35 | 25.35 | 25.35 | 25.35 | 25.35 | 25.35 | 25.35 | 25.35 |
| EBITAT | 29,181.0 | 34,509.1 | 32,695.3 | 33,537.0 | 35,665.4 | 37,009.5 | 35,295.2 | 33,660.3 | 32,101.2 | 30,614.2 |
| Depreciation | ||||||||||
| Changes in Account Receivables | ||||||||||
| Changes in Inventories | ||||||||||
| Changes in Accounts Payable | ||||||||||
| Capital Expenditure | ||||||||||
| UFCF | 14,331.8 | 29,648.0 | 10,513.5 | 48,768.9 | 30,405.4 | 26,751.8 | 35,189.4 | 33,559.5 | 32,005.0 | 30,522.5 |
| WACC, % | 4.94 | 4.95 | 4.95 | 4.95 | 4.95 | 4.95 | 4.95 | 4.95 | 4.95 | 4.95 |
| PV UFCF | ||||||||||
| SUM PV UFCF | 136,835.3 | |||||||||
| Long Term Growth Rate, % | 2.00 | |||||||||
| Free cash flow (T + 1) | 31,133 | |||||||||
| Terminal Value | 1,056,536 | |||||||||
| Present Terminal Value | 829,928 | |||||||||
| Enterprise Value | 966,763 | |||||||||
| Net Debt | -64,479 | |||||||||
| Equity Value | 1,031,242 | |||||||||
| Diluted Shares Outstanding, MM | 1,500 | |||||||||
| Equity Value Per Share | 687.49 |
What You Will Receive
- Actual PETRONETNS Financials: Provides both historical and projected data for precise valuation.
- Customizable Inputs: Adjust WACC, tax rates, revenue growth, and capital expenditures to fit your analysis.
- Dynamic Calculations: Automatically computes intrinsic value and NPV in real-time.
- Scenario Evaluation: Assess various scenarios to forecast Petronet LNG Limited’s future performance.
- User-Friendly Design: Designed for industry professionals, yet easy for newcomers to navigate.
Key Features
- Comprehensive PETRONETNS Data: Pre-loaded with Petronet LNG Limited's historical performance and future projections.
- Flexible Input Options: Modify parameters such as revenue growth, profit margins, discount rates, tax implications, and capital expenditures.
- Adaptive Valuation Model: Automatically recalculates Net Present Value (NPV) and intrinsic value based on your adjustments.
- Scenario Analysis: Generate various forecasting scenarios to explore different valuation results.
- Intuitive Interface: User-friendly layout designed for both professionals and newcomers to navigate easily.
How It Functions
- Download: Obtain the pre-formatted Excel file containing Petronet LNG Limited's (PETRONETNS) financial data.
- Customize: Tailor your forecasts, including revenue growth, EBITDA %, and WACC.
- Update Automatically: Real-time updates for intrinsic value and NPV calculations as you modify inputs.
- Test Scenarios: Develop various projections and instantly compare the results.
- Make Decisions: Leverage the valuation outcomes to inform your investment approach.
Why Opt for This Calculator?
- All-in-One Solution: Combines DCF, WACC, and comprehensive financial ratio assessments seamlessly.
- Flexible Input Options: Modify the yellow-highlighted cells to explore different scenarios.
- In-Depth Analysis: Automatically computes Petronet LNG Limited’s intrinsic value and Net Present Value.
- Data Ready: Historical and projected data provide reliable starting points for analysis.
- High-Quality Standards: Perfect for financial analysts, investors, and business advisors.
Who Should Utilize This Product?
- Institutional Investors: Develop comprehensive and trustworthy valuation models for analyzing portfolios with Petronet LNG Limited (PETRONETNS).
- Corporate Finance Departments: Examine valuation scenarios to inform internal decision-making and strategy regarding Petronet LNG Limited (PETRONETNS).
- Consultants and Financial Advisors: Deliver precise valuation insights to clients interested in Petronet LNG Limited (PETRONETNS).
- Students and Instructors: Utilize real-world data to enhance the learning experience in financial modeling related to Petronet LNG Limited (PETRONETNS).
- Energy Sector Enthusiasts: Gain insights into how companies like Petronet LNG Limited (PETRONETNS) are valued within the industry.
Contents of the Template
- Operating and Balance Sheet Data: Pre-filled historical data and forecasts for Petronet LNG Limited (PETRONETNS), including revenue, EBITDA, EBIT, and capital expenditures.
- WACC Calculation: A specific sheet dedicated to calculating the Weighted Average Cost of Capital (WACC), featuring parameters such as Beta, risk-free rate, and share price.
- DCF Valuation (Unlevered and Levered): Customizable Discounted Cash Flow models that illustrate intrinsic value with comprehensive calculations.
- Financial Statements: Pre-loaded annual and quarterly financial statements to facilitate thorough analysis.
- Key Ratios: A variety of ratios, including profitability, leverage, and efficiency metrics for Petronet LNG Limited (PETRONETNS).
- Dashboard and Charts: A visual summary of valuation outputs and underlying assumptions for easy result analysis.
Disclaimer
All information, articles, and product details provided on this website are for general informational and educational purposes only. We do not claim any ownership over, nor do we intend to infringe upon, any trademarks, copyrights, logos, brand names, or other intellectual property mentioned or depicted on this site. Such intellectual property remains the property of its respective owners, and any references here are made solely for identification or informational purposes, without implying any affiliation, endorsement, or partnership.
We make no representations or warranties, express or implied, regarding the accuracy, completeness, or suitability of any content or products presented. Nothing on this website should be construed as legal, tax, investment, financial, medical, or other professional advice. In addition, no part of this site—including articles or product references—constitutes a solicitation, recommendation, endorsement, advertisement, or offer to buy or sell any securities, franchises, or other financial instruments, particularly in jurisdictions where such activity would be unlawful.
All content is of a general nature and may not address the specific circumstances of any individual or entity. It is not a substitute for professional advice or services. Any actions you take based on the information provided here are strictly at your own risk. You accept full responsibility for any decisions or outcomes arising from your use of this website and agree to release us from any liability in connection with your use of, or reliance upon, the content or products found herein.