
|
Power Finance Corporation Limited (PFC.NS) Évaluation DCF |
Entièrement Modifiable: Adapté À Vos Besoins Dans Excel Ou Sheets
Conception Professionnelle: Modèles Fiables Et Conformes Aux Normes Du Secteur
Pré-Construits Pour Une Utilisation Rapide Et Efficace
Compatible MAC/PC, entièrement débloqué
Aucune Expertise N'Est Requise; Facile À Suivre
Power Finance Corporation Limited (PFC.NS) Bundle
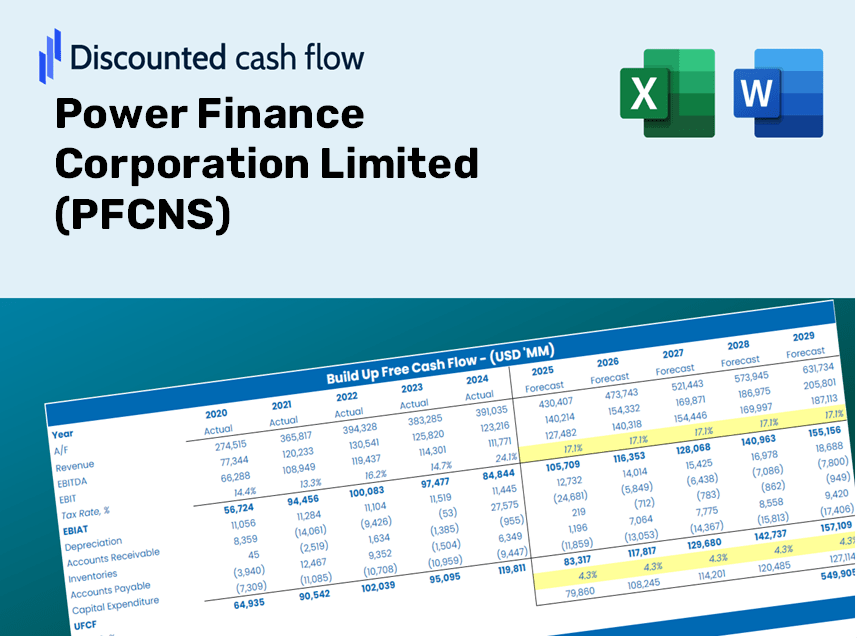
Découvrez le véritable potentiel de Power Finance Corporation Limited (PFCNS) avec notre calculatrice avancée DCF! Ajustez les hypothèses vitales, explorez divers scénarios et évaluez les effets de différents changements sur l'évaluation (PFCN) - le tout dans un modèle d'excel complet.
Discounted Cash Flow (DCF) - (USD MM)
| Year | AY1 2021 |
AY2 2022 |
AY3 2023 |
AY4 2024 |
AY5 2025 |
FY1 2026 |
FY2 2027 |
FY3 2028 |
FY4 2029 |
FY5 2030 |
|---|---|---|---|---|---|---|---|---|---|---|
| Revenue | 267,942.8 | 749,457.8 | 275,173.7 | 910,142.3 | 1,063,476.5 | 1,471,754.8 | 2,036,774.9 | 2,818,711.4 | 3,900,840.4 | 5,398,408.6 |
| Revenue Growth, % | 0 | 179.71 | -63.28 | 230.75 | 16.85 | 38.39 | 38.39 | 38.39 | 38.39 | 38.39 |
| EBITDA | .0 | .0 | .0 | 895,629.7 | 386,878.5 | 396,738.4 | 549,049.8 | 759,835.1 | 1,051,542.7 | 1,455,239.5 |
| EBITDA, % | 0 | 0 | 0 | 98.41 | 36.38 | 26.96 | 26.96 | 26.96 | 26.96 | 26.96 |
| Depreciation | 254.5 | 347.8 | 517.8 | 534.0 | 556.9 | 1,296.9 | 1,794.8 | 2,483.8 | 3,437.4 | 4,757.1 |
| Depreciation, % | 0.09498296 | 0.04640688 | 0.18817 | 0.05867214 | 0.05236599 | 0.08812001 | 0.08812001 | 0.08812001 | 0.08812001 | 0.08812001 |
| EBIT | -254.5 | -347.8 | -517.8 | 895,095.7 | 386,321.6 | 395,441.4 | 547,255.0 | 757,351.2 | 1,048,105.2 | 1,450,482.4 |
| EBIT, % | -0.09498296 | -0.04640688 | -0.18817 | 98.35 | 36.33 | 26.87 | 26.87 | 26.87 | 26.87 | 26.87 |
| Total Cash | 49,277.4 | 9,142.4 | 1,275.9 | 33,885.6 | 95,849.5 | 96,578.1 | 133,655.2 | 184,966.7 | 255,977.1 | 354,249.1 |
| Total Cash, percent | .0 | .0 | .0 | .0 | .0 | .0 | .0 | .0 | .0 | .0 |
| Account Receivables | 366,380.2 | 298,177.7 | 1,637,178.5 | 2,010,298.3 | 2,760.5 | 1,000,926.8 | 1,385,191.7 | 1,916,979.5 | 2,652,925.4 | 3,671,407.6 |
| Account Receivables, % | 136.74 | 39.79 | 594.96 | 220.88 | 0.25957 | 68.01 | 68.01 | 68.01 | 68.01 | 68.01 |
| Inventories | .0 | .0 | .0 | .0 | .0 | .0 | .0 | .0 | .0 | .0 |
| Inventories, % | 0 | 0 | 0 | 0 | 0 | 0 | 0 | 0 | 0 | 0 |
| Accounts Payable | 707.7 | 497.5 | 642.8 | 1,137.2 | 1,521.5 | 2,449.3 | 3,389.7 | 4,691.0 | 6,491.9 | 8,984.2 |
| Accounts Payable, % | 0.26412 | 0.06638132 | 0.2336 | 0.12495 | 0.14307 | 0.16642 | 0.16642 | 0.16642 | 0.16642 | 0.16642 |
| Capital Expenditure | -927.8 | -3,010.1 | -1,227.7 | -3,234.1 | -8,404.7 | -6,886.9 | -9,530.9 | -13,189.9 | -18,253.6 | -25,261.4 |
| Capital Expenditure, % | -0.34627 | -0.40164 | -0.44615 | -0.35534 | -0.7903 | -0.46794 | -0.46794 | -0.46794 | -0.46794 | -0.46794 |
| Tax Rate, % | 40.49 | 40.49 | 40.49 | 40.49 | 40.49 | 40.49 | 40.49 | 40.49 | 40.49 | 40.49 |
| EBITAT | -150.3 | -208.5 | -310.5 | 526,618.6 | 229,908.1 | 235,140.7 | 325,413.3 | 450,342.5 | 623,233.0 | 862,497.9 |
| Depreciation | ||||||||||
| Changes in Account Receivables | ||||||||||
| Changes in Inventories | ||||||||||
| Changes in Accounts Payable | ||||||||||
| Capital Expenditure | ||||||||||
| UFCF | -366,496.1 | 65,121.5 | -1,339,875.9 | 151,293.1 | 2,229,982.4 | -767,687.8 | -65,647.4 | -90,850.0 | -125,728.1 | -173,996.3 |
| WACC, % | 4.31 | 4.36 | 4.36 | 4.29 | 4.33 | 4.33 | 4.33 | 4.33 | 4.33 | 4.33 |
| PV UFCF | ||||||||||
| SUM PV UFCF | -1,123,014.1 | |||||||||
| Long Term Growth Rate, % | 2.00 | |||||||||
| Free cash flow (T + 1) | -177,476 | |||||||||
| Terminal Value | -7,615,549 | |||||||||
| Present Terminal Value | -6,160,925 | |||||||||
| Enterprise Value | -7,283,939 | |||||||||
| Net Debt | 9,621,731 | |||||||||
| Equity Value | -16,905,670 | |||||||||
| Diluted Shares Outstanding, MM | 3,300 | |||||||||
| Equity Value Per Share | -5,123.00 |
What You Will Receive
- Customizable Excel Template: An adaptable Excel-based DCF Calculator featuring pre-filled financial data for PFCNS (Power Finance Corporation Limited).
- Comprehensive Data: Access to historical performance metrics and forward-looking estimates (indicated in the highlighted cells).
- Flexible Projections: Adjust key assumptions such as revenue growth rates, EBITDA percentages, and WACC at your convenience.
- Instant Calculations: Quickly observe how your modifications affect the valuation of Power Finance Corporation.
- Professional Tool: Designed specifically for investors, CFOs, consultants, and financial analysts alike.
- User-Centric Layout: Organized for simplicity and efficiency, complete with step-by-step guidance.
Key Features
- Authentic Power Sector Data: Gain access to reliable historical figures and future forecasts tailored for Power Finance Corporation Limited (PFCNS).
- Adjustable Forecast Inputs: Easily modify highlighted fields for parameters such as WACC, growth rates, and profit margins.
- Real-Time Calculations: Automatic recalculations for DCF, Net Present Value (NPV), and cash flow assessments.
- Interactive Visual Dashboard: User-friendly charts and summaries to effectively illustrate your valuation outcomes.
- Suitable for All Experience Levels: A straightforward and user-friendly design crafted for investors, CFOs, and consultants alike.
How It Functions
- 1. Access the Template: Download and open the Excel spreadsheet containing Power Finance Corporation Limited's (PFCNS) preloaded information.
- 2. Adjust Assumptions: Modify essential inputs such as growth rates, WACC, and capital expenditures.
- 3. Instantly View Results: The DCF model automatically computes intrinsic value and NPV in real-time.
- 4. Explore Scenarios: Assess various forecasts to evaluate different valuation possibilities.
- 5. Present with Assurance: Deliver professional valuation insights to bolster your decision-making.
Why Choose This Calculator for Power Finance Corporation Limited (PFCNS)?
- User-Friendly Design: Suitable for both novice users and seasoned professionals.
- Customizable Inputs: Easily adjust parameters to suit your financial analysis.
- Real-Time Feedback: Observe instant changes in PFCNS’s valuation with every input modification.
- Preloaded Data: Comes equipped with PFCNS’s actual financial metrics for quick insights.
- Relied Upon by Experts: A favored tool among investors and analysts for making well-informed choices.
Who Should Consider Power Finance Corporation Limited (PFCNS)?
- Investors: Assess PFCNS's valuation prior to making stock transactions.
- CFOs and Financial Analysts: Enhance valuation methodologies and evaluate financial forecasts.
- Startup Founders: Understand valuation strategies by analyzing a prominent player like PFCNS.
- Consultants: Create comprehensive valuation reports for clientele.
- Students and Educators: Utilize current data to teach and practice valuation approaches.
Contents of the Template
- Pre-Filled Data: Contains historical financials and forecasts for Power Finance Corporation Limited (PFCNS).
- Discounted Cash Flow Model: An editable DCF valuation model with automated calculations.
- Weighted Average Cost of Capital (WACC): A dedicated worksheet for WACC calculation based on user-defined inputs.
- Key Financial Ratios: Evaluate PFC’s profitability, efficiency, and leverage metrics.
- Customizable Inputs: Easily modify revenue growth, margins, and tax rates.
- Clear Dashboard: Visual representations and tables summarizing essential valuation outcomes.
Disclaimer
All information, articles, and product details provided on this website are for general informational and educational purposes only. We do not claim any ownership over, nor do we intend to infringe upon, any trademarks, copyrights, logos, brand names, or other intellectual property mentioned or depicted on this site. Such intellectual property remains the property of its respective owners, and any references here are made solely for identification or informational purposes, without implying any affiliation, endorsement, or partnership.
We make no representations or warranties, express or implied, regarding the accuracy, completeness, or suitability of any content or products presented. Nothing on this website should be construed as legal, tax, investment, financial, medical, or other professional advice. In addition, no part of this site—including articles or product references—constitutes a solicitation, recommendation, endorsement, advertisement, or offer to buy or sell any securities, franchises, or other financial instruments, particularly in jurisdictions where such activity would be unlawful.
All content is of a general nature and may not address the specific circumstances of any individual or entity. It is not a substitute for professional advice or services. Any actions you take based on the information provided here are strictly at your own risk. You accept full responsibility for any decisions or outcomes arising from your use of this website and agree to release us from any liability in connection with your use of, or reliance upon, the content or products found herein.