
|
Profire Energy, Inc. (PFIE) Valation DCF |
Entièrement Modifiable: Adapté À Vos Besoins Dans Excel Ou Sheets
Conception Professionnelle: Modèles Fiables Et Conformes Aux Normes Du Secteur
Pré-Construits Pour Une Utilisation Rapide Et Efficace
Compatible MAC/PC, entièrement débloqué
Aucune Expertise N'Est Requise; Facile À Suivre
Profire Energy, Inc. (PFIE) Bundle
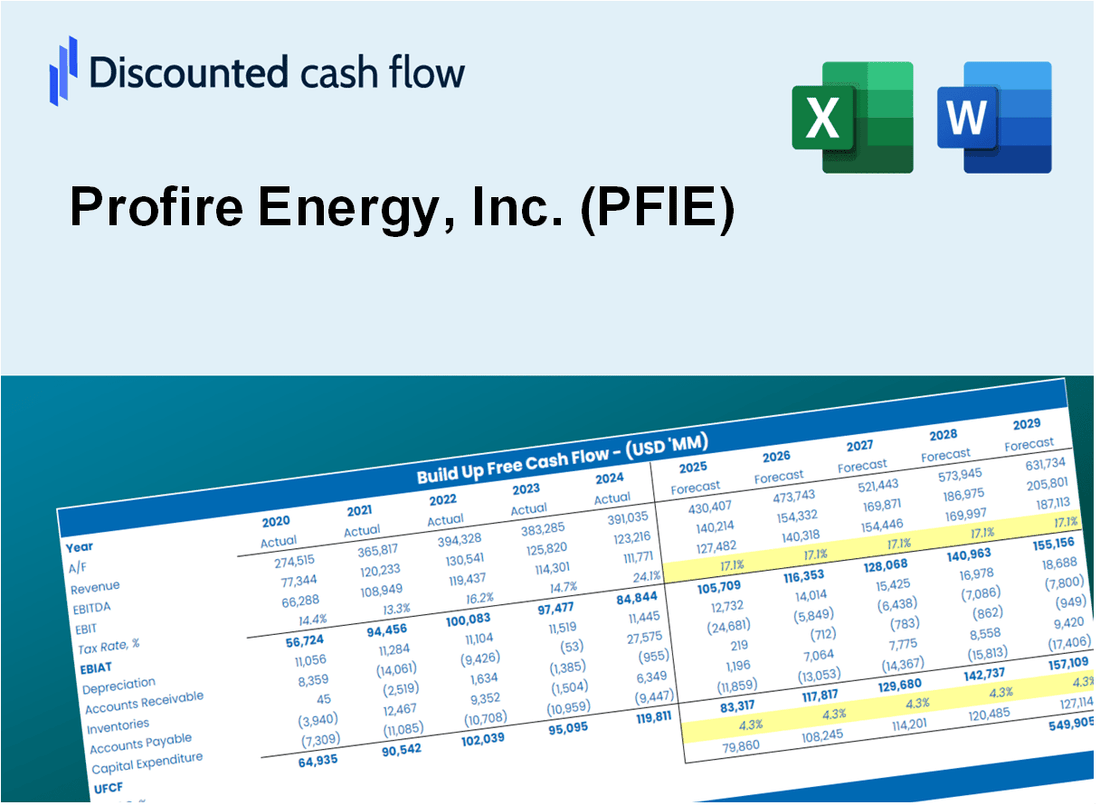
Simplifiez l'évaluation Profire Energy, Inc. (PGIE) avec cette calculatrice DCF personnalisable! Doté de Real Profire Energy, Inc. (PFIE) Financials and Adjustable Forecast Intarts, vous pouvez tester les scénarios et découvrir la juste valeur de Profire Energy, Inc. (PFIE) en minutes.
What You Will Get
- Real PFIE Financial Data: Pre-filled with Profire Energy’s historical and projected data for precise analysis.
- Fully Editable Template: Modify key inputs like revenue growth, WACC, and EBITDA % with ease.
- Automatic Calculations: See Profire Energy’s intrinsic value update instantly based on your changes.
- Professional Valuation Tool: Designed for investors, analysts, and consultants seeking accurate DCF results.
- User-Friendly Design: Simple structure and clear instructions for all experience levels.
Key Features
- Customizable Operational Metrics: Adjust essential inputs such as production rates, operational costs, and capital investment.
- Instant DCF Valuation: Quickly computes intrinsic value, NPV, and additional financial metrics.
- Industry-Leading Precision: Leverages Profire Energy’s actual financial data for accurate valuation results.
- Effortless Scenario Testing: Evaluate various assumptions and analyze results with ease.
- Efficiency Booster: Streamline the valuation process without the hassle of constructing intricate models from the ground up.
How It Works
- Step 1: Download the Excel file for Profire Energy, Inc. (PFIE).
- Step 2: Review Profire Energy’s pre-filled financial data and forecasts.
- Step 3: Modify key inputs such as revenue growth, WACC, and tax rates (highlighted cells).
- Step 4: Observe the DCF model update in real-time as you adjust your assumptions.
- Step 5: Analyze the results and utilize the outputs for your investment decisions.
Why Choose This Calculator for Profire Energy, Inc. (PFIE)?
- All-in-One Solution: Combines DCF, WACC, and financial ratio analyses tailored for Profire Energy.
- Flexible Inputs: Modify yellow-highlighted cells to explore different financial scenarios.
- In-Depth Analysis: Automatically computes Profire Energy’s intrinsic value and Net Present Value.
- Preloaded Information: Historical and projected data provide reliable starting points for analysis.
- Expert-Level Tool: Perfect for financial analysts, investors, and business consultants focused on Profire Energy.
Who Should Use This Product?
- Individual Investors: Make informed decisions about buying or selling Profire Energy, Inc. (PFIE) stock.
- Financial Analysts: Streamline valuation processes with ready-to-use financial models for Profire Energy, Inc. (PFIE).
- Consultants: Deliver professional valuation insights on Profire Energy, Inc. (PFIE) to clients quickly and accurately.
- Business Owners: Understand how companies like Profire Energy, Inc. (PFIE) are valued to guide your own strategy.
- Finance Students: Learn valuation techniques using real-world data and scenarios related to Profire Energy, Inc. (PFIE).
What the Template Contains
- Pre-Filled Data: Contains Profire Energy’s historical financials and projections.
- Discounted Cash Flow Model: Editable DCF valuation model with automated calculations.
- Weighted Average Cost of Capital (WACC): A dedicated sheet for calculating WACC based on user-defined inputs.
- Key Financial Ratios: Assess Profire Energy’s profitability, efficiency, and leverage metrics.
- Customizable Inputs: Easily modify revenue growth, margins, and tax rates.
- Clear Dashboard: Visual representations and tables summarizing essential valuation outcomes.
Disclaimer
All information, articles, and product details provided on this website are for general informational and educational purposes only. We do not claim any ownership over, nor do we intend to infringe upon, any trademarks, copyrights, logos, brand names, or other intellectual property mentioned or depicted on this site. Such intellectual property remains the property of its respective owners, and any references here are made solely for identification or informational purposes, without implying any affiliation, endorsement, or partnership.
We make no representations or warranties, express or implied, regarding the accuracy, completeness, or suitability of any content or products presented. Nothing on this website should be construed as legal, tax, investment, financial, medical, or other professional advice. In addition, no part of this site—including articles or product references—constitutes a solicitation, recommendation, endorsement, advertisement, or offer to buy or sell any securities, franchises, or other financial instruments, particularly in jurisdictions where such activity would be unlawful.
All content is of a general nature and may not address the specific circumstances of any individual or entity. It is not a substitute for professional advice or services. Any actions you take based on the information provided here are strictly at your own risk. You accept full responsibility for any decisions or outcomes arising from your use of this website and agree to release us from any liability in connection with your use of, or reliance upon, the content or products found herein.