
|
PENNYMAC Financial Services, Inc. (PFSI) Évaluation DCF |
Entièrement Modifiable: Adapté À Vos Besoins Dans Excel Ou Sheets
Conception Professionnelle: Modèles Fiables Et Conformes Aux Normes Du Secteur
Pré-Construits Pour Une Utilisation Rapide Et Efficace
Compatible MAC/PC, entièrement débloqué
Aucune Expertise N'Est Requise; Facile À Suivre
PennyMac Financial Services, Inc. (PFSI) Bundle
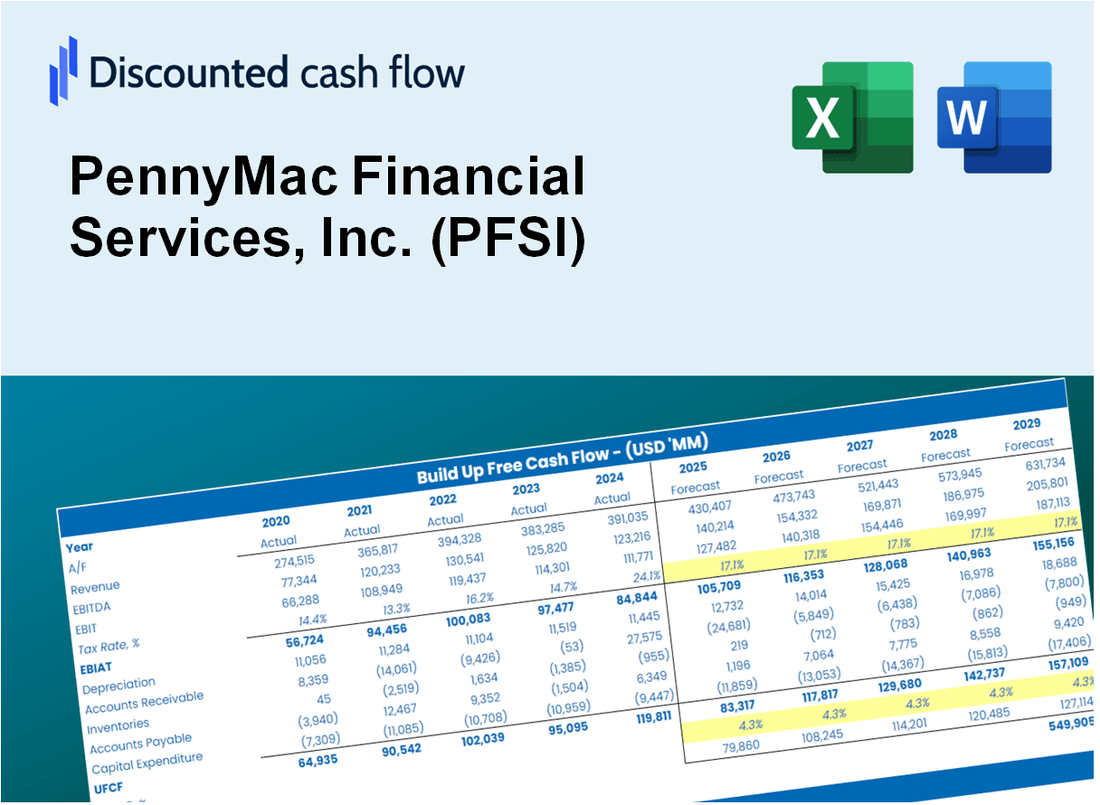
Simplifiez l'évaluation de PennyMac Financial Services, Inc. (PFSI) avec cette calculatrice DCF personnalisable! Doté de Real PennyMac Financial Services, Inc. (PFSI) Financials and Adjustable Forecast Intarts, vous pouvez tester des scénarios et découvrir la juste valeur de PennyMac Financial Services, Inc. (PFSI) en procès-verbal.
Discounted Cash Flow (DCF) - (USD MM)
| Year | AY1 2020 |
AY2 2021 |
AY3 2022 |
AY4 2023 |
AY5 2024 |
FY1 2025 |
FY2 2026 |
FY3 2027 |
FY4 2028 |
FY5 2029 |
|---|---|---|---|---|---|---|---|---|---|---|
| Revenue | 5,181.3 | 4,733.6 | 2,728.4 | 2,746.7 | 1,593.7 | 1,225.9 | 943.0 | 725.4 | 558.0 | 429.2 |
| Revenue Growth, % | 0 | -8.64 | -42.36 | 0.6701 | -41.98 | -23.08 | -23.08 | -23.08 | -23.08 | -23.08 |
| EBITDA | 2,453.1 | 1,680.6 | 1,003.1 | 424.1 | 473.2 | 403.9 | 310.7 | 239.0 | 183.9 | 141.4 |
| EBITDA, % | 47.35 | 35.5 | 36.77 | 15.44 | 29.69 | 32.95 | 32.95 | 32.95 | 32.95 | 32.95 |
| Depreciation | 37.9 | 42.9 | 50.2 | 70.0 | 69.7 | 25.5 | 19.6 | 15.1 | 11.6 | 8.9 |
| Depreciation, % | 0.73068 | 0.90712 | 1.84 | 2.55 | 4.37 | 2.08 | 2.08 | 2.08 | 2.08 | 2.08 |
| EBIT | 2,415.3 | 1,637.6 | 952.9 | 354.0 | 403.5 | 378.4 | 291.1 | 223.9 | 172.2 | 132.5 |
| EBIT, % | 46.62 | 34.6 | 34.92 | 12.89 | 25.32 | 30.87 | 30.87 | 30.87 | 30.87 | 30.87 |
| Total Cash | 547.9 | 346.9 | 1,340.7 | 948.6 | 659.0 | 350.5 | 269.6 | 207.4 | 159.5 | 122.7 |
| Total Cash, percent | .0 | .0 | .0 | .0 | .0 | .0 | .0 | .0 | .0 | .0 |
| Account Receivables | 167.9 | 12,956.0 | 8,328.1 | 9,442.9 | 14,538.9 | 988.7 | 760.5 | 585.0 | 450.0 | 346.2 |
| Account Receivables, % | 3.24 | 273.7 | 305.24 | 343.79 | 912.25 | 80.65 | 80.65 | 80.65 | 80.65 | 80.65 |
| Inventories | .0 | -202.0 | -107.0 | 15.0 | .0 | -18.7 | -14.4 | -11.1 | -8.5 | -6.6 |
| Inventories, % | 0 | -4.27 | -3.92 | 0.54546 | 0 | -1.53 | -1.53 | -1.53 | -1.53 | -1.53 |
| Accounts Payable | 580.5 | 587.4 | 552.9 | 658.1 | 476.7 | 239.7 | 184.4 | 141.8 | 109.1 | 83.9 |
| Accounts Payable, % | 11.2 | 12.41 | 20.27 | 23.96 | 29.91 | 19.55 | 19.55 | 19.55 | 19.55 | 19.55 |
| Capital Expenditure | -84.2 | -56.9 | -83.1 | -36.2 | -22.1 | -21.0 | -16.2 | -12.4 | -9.6 | -7.4 |
| Capital Expenditure, % | -1.63 | -1.2 | -3.05 | -1.32 | -1.39 | -1.72 | -1.72 | -1.72 | -1.72 | -1.72 |
| Tax Rate, % | 22.34 | 22.34 | 22.34 | 22.34 | 22.34 | 22.34 | 22.34 | 22.34 | 22.34 | 22.34 |
| EBITAT | 1,775.3 | 1,209.1 | 681.1 | 278.9 | 313.3 | 284.0 | 218.5 | 168.1 | 129.3 | 99.4 |
| Depreciation | ||||||||||
| Changes in Account Receivables | ||||||||||
| Changes in Inventories | ||||||||||
| Changes in Accounts Payable | ||||||||||
| Capital Expenditure | ||||||||||
| UFCF | 2,141.5 | -11,384.0 | 5,146.6 | -818.9 | -4,901.5 | 13,620.3 | 390.4 | 300.3 | 231.0 | 177.7 |
| WACC, % | 4.99 | 5 | 4.93 | 5.15 | 5.12 | 5.04 | 5.04 | 5.04 | 5.04 | 5.04 |
| PV UFCF | ||||||||||
| SUM PV UFCF | 13,908.7 | |||||||||
| Long Term Growth Rate, % | 2.00 | |||||||||
| Free cash flow (T + 1) | 181 | |||||||||
| Terminal Value | 5,964 | |||||||||
| Present Terminal Value | 4,664 | |||||||||
| Enterprise Value | 18,573 | |||||||||
| Net Debt | 20,315 | |||||||||
| Equity Value | -1,742 | |||||||||
| Diluted Shares Outstanding, MM | 53 | |||||||||
| Equity Value Per Share | -32.66 |
What You Will Get
- Real PFSI Financial Data: Pre-filled with PennyMac’s historical and projected data for precise analysis.
- Fully Editable Template: Modify key inputs like revenue growth, WACC, and EBITDA % with ease.
- Automatic Calculations: See PennyMac’s intrinsic value update instantly based on your changes.
- Professional Valuation Tool: Designed for investors, analysts, and consultants seeking accurate DCF results.
- User-Friendly Design: Simple structure and clear instructions for all experience levels.
Key Features
- Comprehensive Mortgage Calculator: Offers detailed models for various mortgage scenarios tailored for PennyMac Financial Services, Inc. (PFSI).
- Loan Comparison Tool: Pre-built comparison sheet for evaluating different loan options with adjustable parameters.
- Customizable Financial Projections: Modify interest rates, loan terms, and payment schedules to fit your needs.
- Integrated Risk Assessment Metrics: Evaluate credit risk, market risk, and operational risk specific to PennyMac (PFSI).
- User-Friendly Dashboard and Visuals: Intuitive graphical representations of key financial indicators for straightforward analysis.
How It Works
- Download the Template: Gain immediate access to the Excel-based PFSI DCF Calculator.
- Input Your Assumptions: Modify the yellow-highlighted cells for growth rates, WACC, margins, and other key metrics.
- Instant Calculations: The model automatically recalculates PennyMac’s intrinsic value.
- Test Scenarios: Experiment with different assumptions to assess potential valuation impacts.
- Analyze and Decide: Utilize the results to inform your investment or financial decisions.
Why Choose This Calculator for PennyMac Financial Services, Inc. (PFSI)?
- Comprehensive Tool: Features DCF, WACC, and financial ratio analyses all in one convenient package.
- Customizable Inputs: Modify yellow-highlighted cells to explore different financial scenarios.
- Detailed Insights: Automatically computes PennyMac's intrinsic value and Net Present Value.
- Preloaded Data: Access historical and forecasted data for reliable starting points.
- Professional Quality: Perfect for financial analysts, investors, and business consultants alike.
Who Should Use This Product?
- Real Estate Investors: Understand mortgage-backed securities and apply them to your investment strategies.
- Financial Analysts: Utilize advanced models for evaluating loan performance and risk assessment.
- Homebuyers: Analyze mortgage options and make informed decisions on financing with insights from PFSI.
- Portfolio Managers: Enhance your investment portfolio with data-driven insights specific to the mortgage industry.
- Researchers: Study the impact of interest rates and housing market trends on mortgage performance.
What the Template Contains
- Pre-Filled Data: Includes PennyMac Financial Services’ historical financials and forecasts.
- Discounted Cash Flow Model: Editable DCF valuation model with automatic calculations.
- Weighted Average Cost of Capital (WACC): A dedicated sheet for calculating WACC based on custom inputs.
- Key Financial Ratios: Analyze PennyMac’s profitability, efficiency, and leverage.
- Customizable Inputs: Edit revenue growth, margins, and tax rates with ease.
- Clear Dashboard: Charts and tables summarizing key valuation results.
Disclaimer
All information, articles, and product details provided on this website are for general informational and educational purposes only. We do not claim any ownership over, nor do we intend to infringe upon, any trademarks, copyrights, logos, brand names, or other intellectual property mentioned or depicted on this site. Such intellectual property remains the property of its respective owners, and any references here are made solely for identification or informational purposes, without implying any affiliation, endorsement, or partnership.
We make no representations or warranties, express or implied, regarding the accuracy, completeness, or suitability of any content or products presented. Nothing on this website should be construed as legal, tax, investment, financial, medical, or other professional advice. In addition, no part of this site—including articles or product references—constitutes a solicitation, recommendation, endorsement, advertisement, or offer to buy or sell any securities, franchises, or other financial instruments, particularly in jurisdictions where such activity would be unlawful.
All content is of a general nature and may not address the specific circumstances of any individual or entity. It is not a substitute for professional advice or services. Any actions you take based on the information provided here are strictly at your own risk. You accept full responsibility for any decisions or outcomes arising from your use of this website and agree to release us from any liability in connection with your use of, or reliance upon, the content or products found herein.