
|
Power Mech Projects Limited (PowerMech.NS) Valation DCF |
Entièrement Modifiable: Adapté À Vos Besoins Dans Excel Ou Sheets
Conception Professionnelle: Modèles Fiables Et Conformes Aux Normes Du Secteur
Pré-Construits Pour Une Utilisation Rapide Et Efficace
Compatible MAC/PC, entièrement débloqué
Aucune Expertise N'Est Requise; Facile À Suivre
Power Mech Projects Limited (POWERMECH.NS) Bundle
Découvrez le véritable potentiel des projets Power Mech Limited avec notre calculatrice avancée DCF! Ajustez les hypothèses clés, explorez divers scénarios et évaluez comment les modifications affectent l'évaluation de Power Mech Projects Limited - tout dans un modèle Excel.
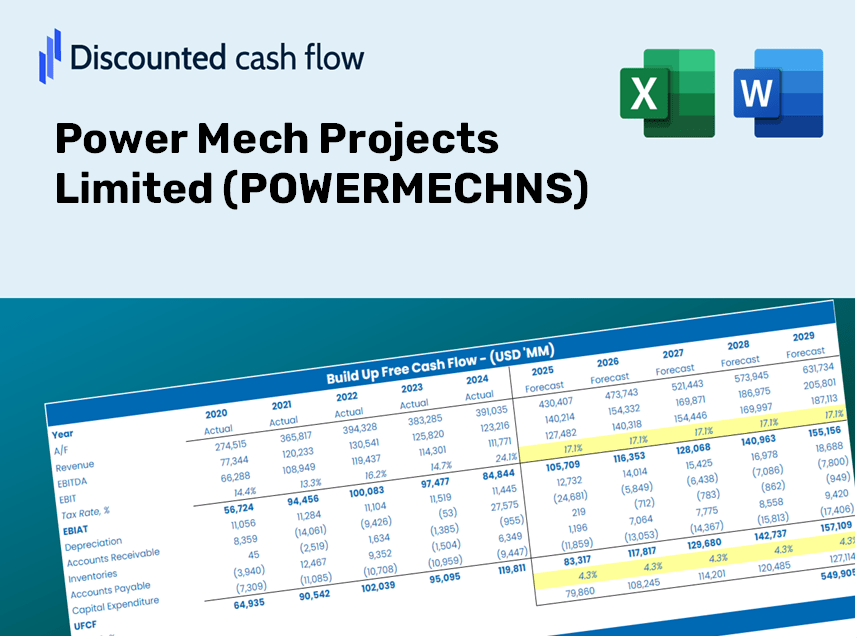
Discounted Cash Flow (DCF) - (USD MM)
| Year | AY1 2021 |
AY2 2022 |
AY3 2023 |
AY4 2024 |
AY5 2025 |
FY1 2026 |
FY2 2027 |
FY3 2028 |
FY4 2029 |
FY5 2030 |
|---|---|---|---|---|---|---|---|---|---|---|
| Revenue | 18,840.8 | 27,104.9 | 36,011.9 | 42,066.5 | 52,341.4 | 67,777.2 | 87,765.0 | 113,647.4 | 147,162.6 | 190,561.6 |
| Revenue Growth, % | 0 | 43.86 | 32.86 | 16.81 | 24.43 | 29.49 | 29.49 | 29.49 | 29.49 | 29.49 |
| EBITDA | 572.7 | 2,864.6 | 4,200.1 | 4,981.5 | 6,039.8 | 6,595.1 | 8,540.0 | 11,058.5 | 14,319.7 | 18,542.6 |
| EBITDA, % | 3.04 | 10.57 | 11.66 | 11.84 | 11.54 | 9.73 | 9.73 | 9.73 | 9.73 | 9.73 |
| Depreciation | 357.6 | 369.0 | 429.1 | 440.4 | 558.0 | 889.8 | 1,152.2 | 1,491.9 | 1,931.9 | 2,501.7 |
| Depreciation, % | 1.9 | 1.36 | 1.19 | 1.05 | 1.07 | 1.31 | 1.31 | 1.31 | 1.31 | 1.31 |
| EBIT | 215.1 | 2,495.6 | 3,771.0 | 4,541.1 | 5,481.8 | 5,705.3 | 7,387.8 | 9,566.5 | 12,387.7 | 16,041.0 |
| EBIT, % | 1.14 | 9.21 | 10.47 | 10.8 | 10.47 | 8.42 | 8.42 | 8.42 | 8.42 | 8.42 |
| Total Cash | 161.1 | 759.4 | 448.6 | 524.0 | 5,933.3 | 2,370.0 | 3,068.9 | 3,974.0 | 5,145.9 | 6,663.5 |
| Total Cash, percent | .0 | .0 | .0 | .0 | .0 | .0 | .0 | .0 | .0 | .0 |
| Account Receivables | 10,970.6 | 12,118.4 | 15,717.0 | 18,737.9 | 14,776.7 | 29,734.7 | 38,503.6 | 49,858.5 | 64,562.0 | 83,601.7 |
| Account Receivables, % | 58.23 | 44.71 | 43.64 | 44.54 | 28.23 | 43.87 | 43.87 | 43.87 | 43.87 | 43.87 |
| Inventories | 1,435.4 | 1,588.6 | 1,700.7 | 1,539.3 | 1,979.6 | 3,476.1 | 4,501.2 | 5,828.6 | 7,547.5 | 9,773.3 |
| Inventories, % | 7.62 | 5.86 | 4.72 | 3.66 | 3.78 | 5.13 | 5.13 | 5.13 | 5.13 | 5.13 |
| Accounts Payable | 5,126.1 | 5,393.2 | 7,490.7 | 7,195.0 | 9,299.8 | 13,931.9 | 18,040.5 | 23,360.7 | 30,249.9 | 39,170.7 |
| Accounts Payable, % | 27.21 | 19.9 | 20.8 | 17.1 | 17.77 | 20.56 | 20.56 | 20.56 | 20.56 | 20.56 |
| Capital Expenditure | -269.1 | -438.3 | -536.5 | -923.2 | -1,625.8 | -1,333.3 | -1,726.5 | -2,235.7 | -2,895.0 | -3,748.7 |
| Capital Expenditure, % | -1.43 | -1.62 | -1.49 | -2.19 | -3.11 | -1.97 | -1.97 | -1.97 | -1.97 | -1.97 |
| Tax Rate, % | 33.54 | 33.54 | 33.54 | 33.54 | 33.54 | 33.54 | 33.54 | 33.54 | 33.54 | 33.54 |
| EBITAT | 163.7 | 1,878.3 | 2,816.6 | 2,946.7 | 3,643.2 | 4,078.5 | 5,281.3 | 6,838.7 | 8,855.5 | 11,467.0 |
| Depreciation | ||||||||||
| Changes in Account Receivables | ||||||||||
| Changes in Inventories | ||||||||||
| Changes in Accounts Payable | ||||||||||
| Capital Expenditure | ||||||||||
| UFCF | -7,027.7 | 775.1 | 1,096.0 | -691.3 | 8,201.1 | -8,187.4 | -978.5 | -1,267.1 | -1,640.8 | -2,124.6 |
| WACC, % | 5.66 | 5.65 | 5.65 | 5.54 | 5.56 | 5.61 | 5.61 | 5.61 | 5.61 | 5.61 |
| PV UFCF | ||||||||||
| SUM PV UFCF | -12,640.9 | |||||||||
| Long Term Growth Rate, % | 3.50 | |||||||||
| Free cash flow (T + 1) | -2,199 | |||||||||
| Terminal Value | -104,082 | |||||||||
| Present Terminal Value | -79,213 | |||||||||
| Enterprise Value | -91,854 | |||||||||
| Net Debt | 1,423 | |||||||||
| Equity Value | -93,276 | |||||||||
| Diluted Shares Outstanding, MM | 32 | |||||||||
| Equity Value Per Share | -2,950.19 |
What You Will Receive
- Genuine POWERMECHNS Financials: Provides historical and predictive data for precise valuation.
- Customizable Inputs: Adjust WACC, tax rates, revenue growth, and capital expenditures to fit your analysis.
- Automated Calculations: Dynamic calculations of intrinsic value and NPV.
- Scenario Analysis: Evaluate various scenarios to assess the future performance of Power Mech Projects Limited.
- User-Friendly Design: Designed for professionals while remaining approachable for newcomers.
Key Features
- 🔍 Real-Life POWERMECHNS Financials: Pre-filled historical and projected data for Power Mech Projects Limited.
- ✏️ Fully Customizable Inputs: Modify all essential parameters (yellow cells) such as WACC, growth %, and tax rates.
- 📊 Professional DCF Valuation: Integrated formulas compute the intrinsic value of Power Mech Projects Limited using the Discounted Cash Flow method.
- ⚡ Instant Results: View Power Mech Projects Limited’s valuation immediately after adjustments.
- Scenario Analysis: Evaluate and compare different outcomes for various financial assumptions side-by-side.
How It Functions
- Download: Obtain the pre-formatted Excel file featuring Power Mech Projects Limited's (POWERMECHNS) financial data.
- Customize: Modify your forecasts, including revenue growth, EBITDA %, and weighted average cost of capital (WACC).
- Update Automatically: Enjoy real-time updates for intrinsic value and net present value (NPV) calculations.
- Test Scenarios: Generate various projections and quickly compare results.
- Make Decisions: Leverage the valuation outcomes to inform your investment approach.
Why Opt for Power Mech Projects Limited (POWERMECHNS)?
- Time Efficient: Get started quickly with our pre-built models—no need to build from the ground up.
- Enhanced Precision: Our reliable financial insights and formulas minimize valuation errors.
- Completely Customizable: Adjust the model to fit your unique assumptions and forecasts.
- User-Friendly: Intuitive charts and outputs simplify the analysis of results.
- Endorsed by Professionals: Crafted for industry experts who prioritize accuracy and functionality.
Who Can Benefit from This Product?
- Professional Investors: Develop comprehensive and precise valuation models for in-depth portfolio analysis of Power Mech Projects Limited (POWERMECHNS).
- Corporate Finance Teams: Evaluate valuation scenarios to inform strategic decisions within their organization.
- Consultants and Advisors: Equip clients with reliable valuation insights specifically for Power Mech Projects Limited (POWERMECHNS).
- Students and Educators: Utilize real-world data to enhance learning and practice in financial modeling.
- Industry Enthusiasts: Gain insights into how companies like Power Mech Projects Limited (POWERMECHNS) are valued in the marketplace.
Contents of the Template
- Pre-Populated Data: Contains historical financial performance and projections for Power Mech Projects Limited (POWERMECHNS).
- Discounted Cash Flow Model: An editable DCF valuation model equipped with automatic calculations.
- Weighted Average Cost of Capital (WACC): A specialized sheet for calculating WACC using customized inputs.
- Essential Financial Ratios: Evaluate Power Mech’s profitability, efficiency, and financial leverage.
- Adjustable Inputs: Effortlessly modify revenue growth, profit margins, and tax rates.
- User-Friendly Dashboard: Visuals and tables summarizing fundamental valuation outcomes.
Disclaimer
All information, articles, and product details provided on this website are for general informational and educational purposes only. We do not claim any ownership over, nor do we intend to infringe upon, any trademarks, copyrights, logos, brand names, or other intellectual property mentioned or depicted on this site. Such intellectual property remains the property of its respective owners, and any references here are made solely for identification or informational purposes, without implying any affiliation, endorsement, or partnership.
We make no representations or warranties, express or implied, regarding the accuracy, completeness, or suitability of any content or products presented. Nothing on this website should be construed as legal, tax, investment, financial, medical, or other professional advice. In addition, no part of this site—including articles or product references—constitutes a solicitation, recommendation, endorsement, advertisement, or offer to buy or sell any securities, franchises, or other financial instruments, particularly in jurisdictions where such activity would be unlawful.
All content is of a general nature and may not address the specific circumstances of any individual or entity. It is not a substitute for professional advice or services. Any actions you take based on the information provided here are strictly at your own risk. You accept full responsibility for any decisions or outcomes arising from your use of this website and agree to release us from any liability in connection with your use of, or reliance upon, the content or products found herein.