
|
Prothena Corporation Plc (PRTA) Évaluation DCF |
Entièrement Modifiable: Adapté À Vos Besoins Dans Excel Ou Sheets
Conception Professionnelle: Modèles Fiables Et Conformes Aux Normes Du Secteur
Pré-Construits Pour Une Utilisation Rapide Et Efficace
Compatible MAC/PC, entièrement débloqué
Aucune Expertise N'Est Requise; Facile À Suivre
Prothena Corporation plc (PRTA) Bundle
Améliorez vos choix d'investissement avec la calculatrice DCF Prothena Corporation Plc (PRTA)! Utilisez de réelles données financières de Prothena, ajustez les projections et dépenses de croissance et observez instantanément comment ces changements affectent la valeur intrinsèque de Prothena Corporation plc (PRTA).
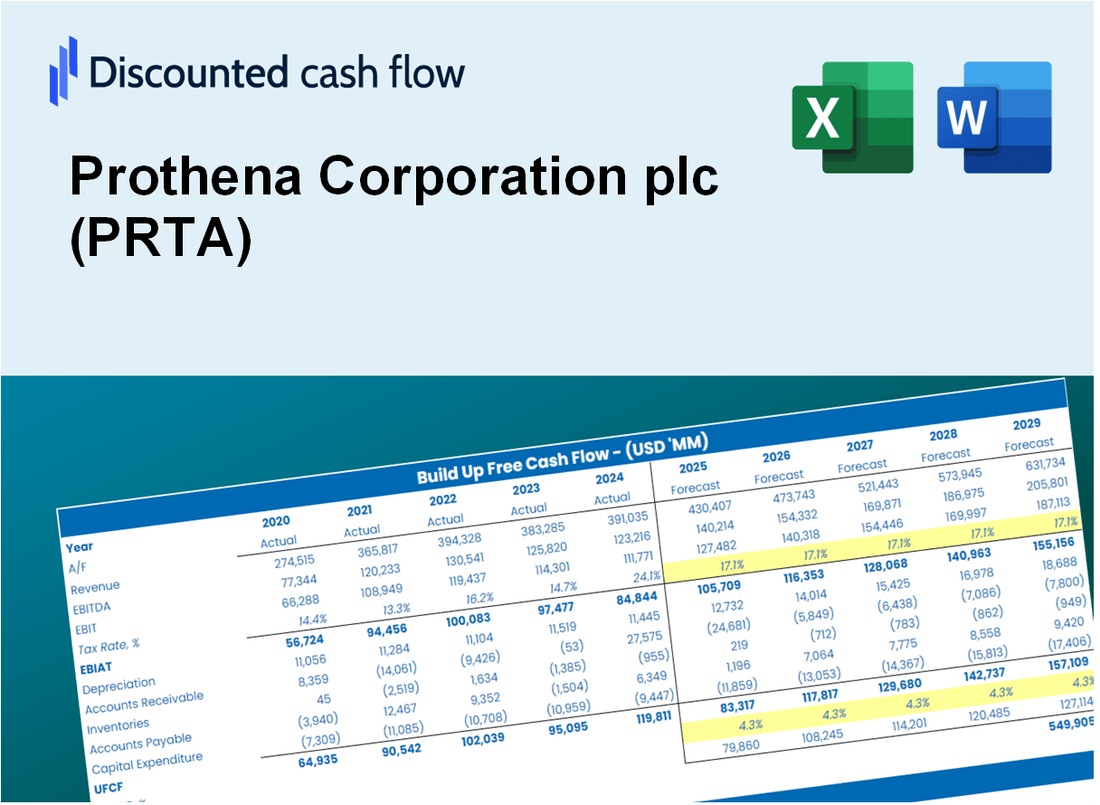
Discounted Cash Flow (DCF) - (USD MM)
| Year | AY1 2020 |
AY2 2021 |
AY3 2022 |
AY4 2023 |
AY5 2024 |
FY1 2025 |
FY2 2026 |
FY3 2027 |
FY4 2028 |
FY5 2029 |
|---|---|---|---|---|---|---|---|---|---|---|
| Revenue | .9 | 200.6 | 53.9 | 91.4 | 135.2 | 183.9 | 250.3 | 340.5 | 463.4 | 630.6 |
| Revenue Growth, % | 0 | 23414.3 | -73.13 | 69.5 | 47.92 | 36.07 | 36.07 | 36.07 | 36.07 | 36.07 |
| EBITDA | -111.2 | 73.1 | -130.8 | -190.1 | -153.7 | -133.7 | -182.0 | -247.6 | -336.9 | -458.5 |
| EBITDA, % | -13038.69 | 36.44 | -242.67 | -208.06 | -113.7 | -72.71 | -72.71 | -72.71 | -72.71 | -72.71 |
| Depreciation | 1.5 | 1.1 | .7 | .9 | .9 | 38.1 | 51.9 | 70.6 | 96.0 | 130.7 |
| Depreciation, % | 177.49 | 0.5559 | 1.38 | 1.02 | 0.66071 | 20.72 | 20.72 | 20.72 | 20.72 | 20.72 |
| EBIT | -112.7 | 72.0 | -131.6 | -191.0 | -154.6 | -133.9 | -182.2 | -248.0 | -337.5 | -459.2 |
| EBIT, % | -13216.18 | 35.88 | -244.05 | -209.08 | -114.36 | -72.82 | -72.82 | -72.82 | -72.82 | -72.82 |
| Total Cash | 295.4 | 579.1 | 710.4 | 618.8 | 471.4 | 183.9 | 250.3 | 340.5 | 463.4 | 630.6 |
| Total Cash, percent | .0 | .0 | .0 | .0 | .0 | .0 | .0 | .0 | .0 | .0 |
| Account Receivables | .0 | .0 | .1 | 5.2 | .0 | 2.8 | 3.8 | 5.1 | 7.0 | 9.5 |
| Account Receivables, % | 1.76 | 0.0064813 | 0.11502 | 5.65 | 0 | 1.51 | 1.51 | 1.51 | 1.51 | 1.51 |
| Inventories | .0 | .0 | .0 | .0 | .0 | .0 | .0 | .0 | .0 | .0 |
| Inventories, % | 0 | 0 | 0 | 0 | 0 | 0 | 0 | 0 | 0 | 0 |
| Accounts Payable | 4.1 | 3.7 | 9.3 | 25.4 | 7.8 | 56.1 | 76.4 | 103.9 | 141.4 | 192.4 |
| Accounts Payable, % | 482.65 | 1.84 | 17.2 | 27.79 | 5.75 | 30.52 | 30.52 | 30.52 | 30.52 | 30.52 |
| Capital Expenditure | -.2 | -.6 | -.5 | -2.8 | -.3 | -10.1 | -13.7 | -18.7 | -25.4 | -34.6 |
| Capital Expenditure, % | -22.98 | -0.28667 | -0.86077 | -3.08 | -0.22048 | -5.48 | -5.48 | -5.48 | -5.48 | -5.48 |
| Tax Rate, % | 5.13 | 5.13 | 5.13 | 5.13 | 5.13 | 5.13 | 5.13 | 5.13 | 5.13 | 5.13 |
| EBITAT | -113.0 | 67.0 | -122.5 | -175.0 | -146.6 | -126.6 | -172.3 | -234.5 | -319.0 | -434.1 |
| Depreciation | ||||||||||
| Changes in Account Receivables | ||||||||||
| Changes in Inventories | ||||||||||
| Changes in Accounts Payable | ||||||||||
| Capital Expenditure | ||||||||||
| UFCF | -107.6 | 67.1 | -116.7 | -165.9 | -158.5 | -53.0 | -114.9 | -156.4 | -212.8 | -289.6 |
| WACC, % | 4.67 | 4.66 | 4.66 | 4.66 | 4.66 | 4.66 | 4.66 | 4.66 | 4.66 | 4.66 |
| PV UFCF | ||||||||||
| SUM PV UFCF | -699.9 | |||||||||
| Long Term Growth Rate, % | 2.00 | |||||||||
| Free cash flow (T + 1) | -295 | |||||||||
| Terminal Value | -11,098 | |||||||||
| Present Terminal Value | -8,838 | |||||||||
| Enterprise Value | -9,537 | |||||||||
| Net Debt | -461 | |||||||||
| Equity Value | -9,077 | |||||||||
| Diluted Shares Outstanding, MM | 54 | |||||||||
| Equity Value Per Share | -168.80 |
What You Will Receive
- Comprehensive Financial Model: Prothena Corporation plc’s actual data provides an accurate DCF valuation.
- Complete Forecast Control: Modify revenue growth, profit margins, WACC, and other essential drivers.
- Real-Time Calculations: Automatic updates allow you to see results instantly as you adjust inputs.
- Professional-Grade Template: A polished Excel file crafted for high-quality valuation.
- Flexible and Reusable: Designed for adaptability, enabling repeated use for in-depth forecasts.
Key Features
- Customizable Financial Inputs: Adjust essential metrics such as revenue projections, operating margin, and research & development expenses.
- Instant DCF Valuation: Automatically computes intrinsic value, net present value, and other key financial metrics.
- High-Precision Estimates: Incorporates Prothena’s actual financial data for accurate valuation results.
- Effortless Scenario Testing: Evaluate various assumptions and analyze results with ease.
- Efficiency Booster: Streamline the valuation process without the hassle of creating intricate models from the ground up.
How It Works
- Step 1: Download the Excel file.
- Step 2: Review Prothena Corporation plc’s pre-filled financial data and forecasts.
- Step 3: Modify key inputs such as revenue growth, WACC, and tax rates (highlighted cells).
- Step 4: Observe the DCF model update instantly as you adjust your assumptions.
- Step 5: Analyze the outputs and leverage the results for your investment decisions.
Why Choose Prothena Corporation plc (PRTA)?
- Innovative Solutions: Pioneering advancements in neuroscience and protein misfolding.
- Strong Pipeline: Diverse portfolio of therapies targeting significant unmet medical needs.
- Expert Team: Led by experienced professionals dedicated to scientific excellence.
- Commitment to Quality: Adherence to rigorous standards in research and development.
- Proven Track Record: Established history of successful collaborations and partnerships.
Who Should Use This Product?
- Investors: Gain insights and make informed decisions with Prothena's innovative solutions.
- Healthcare Analysts: Streamline your research with comprehensive data on Prothena's pipeline and market potential.
- Consultants: Efficiently tailor presentations or reports focusing on Prothena's advancements in biotechnology.
- Biotech Enthusiasts: Enhance your knowledge of drug development processes and industry trends through Prothena's resources.
- Educators and Students: Utilize Prothena's materials as a practical reference in biotechnology and pharmaceutical studies.
What the Template Contains
- Operating and Balance Sheet Data: Pre-filled Prothena Corporation plc (PRTA) historical data and forecasts, including revenue, EBITDA, EBIT, and capital expenditures.
- WACC Calculation: A dedicated sheet for Weighted Average Cost of Capital (WACC), including parameters like Beta, risk-free rate, and share price.
- DCF Valuation (Unlevered and Levered): Editable Discounted Cash Flow models showing intrinsic value with detailed calculations.
- Financial Statements: Pre-loaded financial statements (annual and quarterly) to support analysis.
- Key Ratios: Includes profitability, leverage, and efficiency ratios for Prothena Corporation plc (PRTA).
- Dashboard and Charts: Visual summary of valuation outputs and assumptions to analyze results easily.
Disclaimer
All information, articles, and product details provided on this website are for general informational and educational purposes only. We do not claim any ownership over, nor do we intend to infringe upon, any trademarks, copyrights, logos, brand names, or other intellectual property mentioned or depicted on this site. Such intellectual property remains the property of its respective owners, and any references here are made solely for identification or informational purposes, without implying any affiliation, endorsement, or partnership.
We make no representations or warranties, express or implied, regarding the accuracy, completeness, or suitability of any content or products presented. Nothing on this website should be construed as legal, tax, investment, financial, medical, or other professional advice. In addition, no part of this site—including articles or product references—constitutes a solicitation, recommendation, endorsement, advertisement, or offer to buy or sell any securities, franchises, or other financial instruments, particularly in jurisdictions where such activity would be unlawful.
All content is of a general nature and may not address the specific circumstances of any individual or entity. It is not a substitute for professional advice or services. Any actions you take based on the information provided here are strictly at your own risk. You accept full responsibility for any decisions or outcomes arising from your use of this website and agree to release us from any liability in connection with your use of, or reliance upon, the content or products found herein.