
|
Puretech Health Plc (PRTC) Valation DCF |
Entièrement Modifiable: Adapté À Vos Besoins Dans Excel Ou Sheets
Conception Professionnelle: Modèles Fiables Et Conformes Aux Normes Du Secteur
Pré-Construits Pour Une Utilisation Rapide Et Efficace
Compatible MAC/PC, entièrement débloqué
Aucune Expertise N'Est Requise; Facile À Suivre
PureTech Health plc (PRTC) Bundle
Révaluez la vraie valeur de Puretech Health Plc avec notre calculatrice DCF de qualité professionnelle! Ajustez les hypothèses clés, explorez divers scénarios et examinez comment les changements affectent l'évaluation Puretech Health Plc (PRTC) - le tout dans un seul modèle Excel.
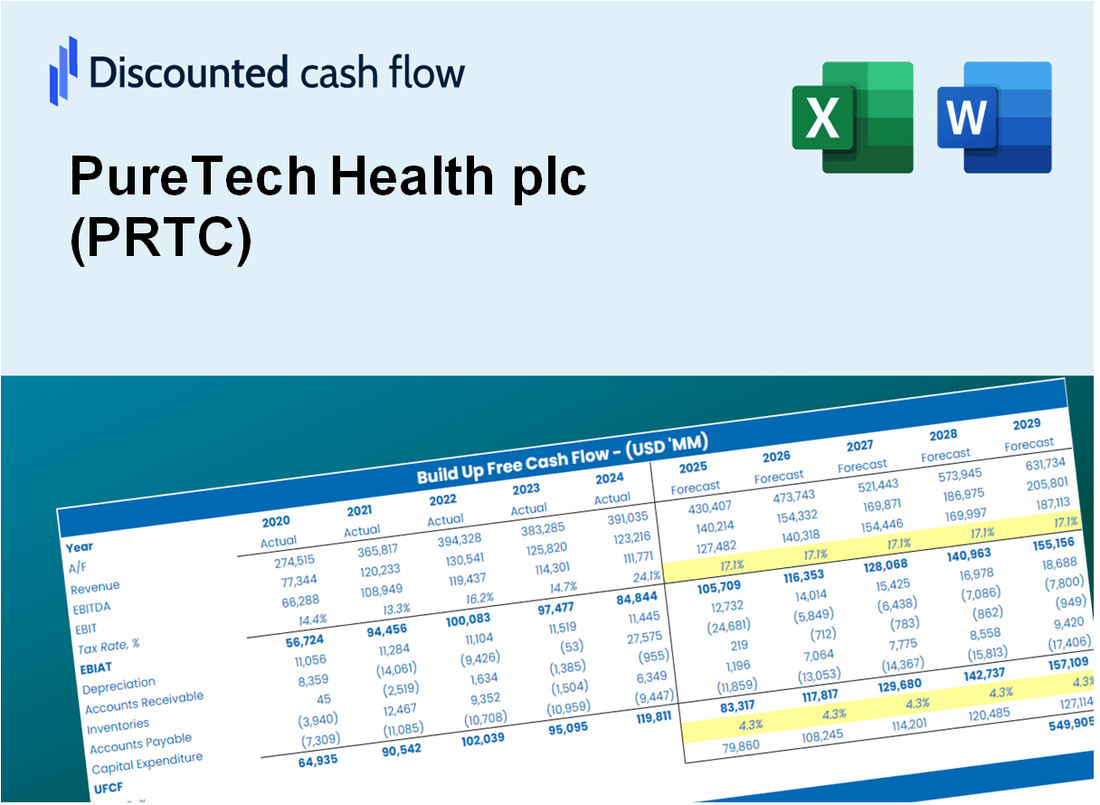
Discounted Cash Flow (DCF) - (USD MM)
| Year | AY1 2020 |
AY2 2021 |
AY3 2022 |
AY4 2023 |
AY5 2024 |
FY1 2025 |
FY2 2026 |
FY3 2027 |
FY4 2028 |
FY5 2029 |
|---|---|---|---|---|---|---|---|---|---|---|
| Revenue | 8.3 | 10.0 | 2.1 | 3.3 | 4.8 | 5.4 | 6.0 | 6.6 | 7.4 | 8.2 |
| Revenue Growth, % | 0 | 19.64 | -79.06 | 59.33 | 44.98 | 11.22 | 11.22 | 11.22 | 11.22 | 11.22 |
| EBITDA | 62.7 | 26.7 | -188.9 | -11.6 | 37.4 | 1.1 | 1.2 | 1.3 | 1.5 | 1.6 |
| EBITDA, % | 751.55 | 267.58 | -9038.9 | -349.16 | 774.28 | 20 | 20 | 20 | 20 | 20 |
| Depreciation | 6.7 | 7.2 | 8.9 | 4.9 | 3.6 | 4.6 | 5.1 | 5.7 | 6.3 | 7.0 |
| Depreciation, % | 79.79 | 72.53 | 425.5 | 148.14 | 73.96 | 85.26 | 85.26 | 85.26 | 85.26 | 85.26 |
| EBIT | 56.0 | 19.5 | -197.8 | -16.6 | 33.8 | 1.1 | 1.2 | 1.3 | 1.5 | 1.6 |
| EBIT, % | 671.77 | 195.05 | -9464.4 | -497.3 | 700.31 | 20 | 20 | 20 | 20 | 20 |
| Total Cash | 403.9 | 465.7 | 350.1 | 327.1 | 367.3 | 5.4 | 6.0 | 6.6 | 7.4 | 8.2 |
| Total Cash, percent | .0 | .0 | .0 | .0 | .0 | .0 | .0 | .0 | .0 | .0 |
| Account Receivables | 2.9 | 3.6 | 22.4 | 2.4 | 12.9 | 3.7 | 4.1 | 4.6 | 5.1 | 5.6 |
| Account Receivables, % | 35.24 | 35.97 | 1069.71 | 71.35 | 267.25 | 68.51 | 68.51 | 68.51 | 68.51 | 68.51 |
| Inventories | .0 | 28.0 | .0 | .0 | .0 | 1.1 | 1.2 | 1.3 | 1.5 | 1.6 |
| Inventories, % | 0 | 280.58 | 0 | 0 | 0 | 20 | 20 | 20 | 20 | 20 |
| Accounts Payable | 8.9 | 11.3 | 26.5 | 14.6 | 5.5 | 5.4 | 6.0 | 6.6 | 7.4 | 8.2 |
| Accounts Payable, % | 106.34 | 113.69 | 1268.09 | 439.52 | 114.37 | 100 | 100 | 100 | 100 | 100 |
| Capital Expenditure | -5.4 | -5.7 | -2.2 | -.2 | .0 | -2.5 | -2.7 | -3.0 | -3.4 | -3.8 |
| Capital Expenditure, % | -65.03 | -56.73 | -104.11 | -7.36 | -0.22784 | -45.87 | -45.87 | -45.87 | -45.87 | -45.87 |
| Tax Rate, % | -125.08 | -125.08 | -125.08 | -125.08 | -125.08 | -125.08 | -125.08 | -125.08 | -125.08 | -125.08 |
| EBITAT | 17.7 | 20.0 | -107.4 | -30.1 | 76.1 | .8 | .9 | 1.0 | 1.1 | 1.3 |
| Depreciation | ||||||||||
| Changes in Account Receivables | ||||||||||
| Changes in Inventories | ||||||||||
| Changes in Accounts Payable | ||||||||||
| Capital Expenditure | ||||||||||
| UFCF | 24.8 | -4.6 | -76.2 | -17.3 | 60.0 | 10.9 | 3.3 | 3.7 | 4.1 | 4.6 |
| WACC, % | 9.91 | 20.32 | 13.36 | 20.32 | 20.32 | 16.85 | 16.85 | 16.85 | 16.85 | 16.85 |
| PV UFCF | ||||||||||
| SUM PV UFCF | 18.5 | |||||||||
| Long Term Growth Rate, % | 2.00 | |||||||||
| Free cash flow (T + 1) | 5 | |||||||||
| Terminal Value | 32 | |||||||||
| Present Terminal Value | 15 | |||||||||
| Enterprise Value | 33 | |||||||||
| Net Debt | -258 | |||||||||
| Equity Value | 291 | |||||||||
| Diluted Shares Outstanding, MM | 3 | |||||||||
| Equity Value Per Share | 108.01 |
What You Will Get
- Comprehensive PRTC Financials: Access to historical and projected data for precise valuation.
- Customizable Inputs: Adjust WACC, tax rates, revenue growth, and capital expenditures as needed.
- Real-Time Calculations: Intrinsic value and NPV are calculated automatically.
- Scenario Analysis: Evaluate multiple scenarios to assess PureTech Health’s future performance.
- User-Friendly Design: Crafted for professionals while remaining approachable for newcomers.
Key Features
- Comprehensive Data: PureTech Health plc's (PRTC) historical financial records and pre-filled projections.
- Customizable Inputs: Adjust WACC, tax rates, revenue growth, and EBITDA margins as needed.
- Real-Time Results: View PureTech Health plc's (PRTC) intrinsic value recalculating instantly.
- Intuitive Visual Outputs: Dashboard graphs showcase valuation outcomes and essential metrics.
- Designed for Precision: A professional-grade tool for analysts, investors, and financial professionals.
How It Works
- Step 1: Download the prebuilt Excel template featuring PureTech Health plc’s (PRTC) data.
- Step 2: Navigate through the pre-filled sheets to grasp the essential metrics.
- Step 3: Revise forecasts and assumptions in the editable yellow cells (WACC, growth, margins).
- Step 4: Instantly access recalculated results, including PureTech Health plc’s (PRTC) intrinsic value.
- Step 5: Make well-informed investment decisions or create reports based on the outputs.
Why Choose This Calculator for PureTech Health plc (PRTC)?
- All-in-One Solution: Features DCF, WACC, and financial ratio analyses tailored for PureTech Health plc (PRTC).
- Flexible Inputs: Modify the yellow-highlighted cells to explore different financial scenarios.
- In-Depth Analysis: Automatically computes PureTech Health plc's (PRTC) intrinsic value and Net Present Value.
- Preloaded Information: Historical and projected data provide reliable foundational insights.
- Expert-Level Tool: Perfect for financial analysts, investors, and business advisors focusing on PureTech Health plc (PRTC).
Who Should Use PureTech Health plc (PRTC)?
- Investors: Gain insights into innovative healthcare solutions with a trusted partner.
- Healthcare Analysts: Streamline your research with access to comprehensive market data and analysis.
- Consultants: Easily modify reports and presentations to showcase client opportunities in biotech.
- Biotech Enthusiasts: Enhance your knowledge of emerging therapies and their market potential.
- Educators and Students: Utilize it as a case study in biotechnology and healthcare investment courses.
What the Template Contains
- Preloaded PRTC Data: Historical and projected financial data, including revenue, EBIT, and capital expenditures.
- DCF and WACC Models: Professional-grade sheets for calculating intrinsic value and Weighted Average Cost of Capital.
- Editable Inputs: Yellow-highlighted cells for adjusting revenue growth, tax rates, and discount rates.
- Financial Statements: Comprehensive annual and quarterly financials for deeper analysis.
- Key Ratios: Profitability, leverage, and efficiency ratios to evaluate performance.
- Dashboard and Charts: Visual summaries of valuation outcomes and assumptions.
Disclaimer
All information, articles, and product details provided on this website are for general informational and educational purposes only. We do not claim any ownership over, nor do we intend to infringe upon, any trademarks, copyrights, logos, brand names, or other intellectual property mentioned or depicted on this site. Such intellectual property remains the property of its respective owners, and any references here are made solely for identification or informational purposes, without implying any affiliation, endorsement, or partnership.
We make no representations or warranties, express or implied, regarding the accuracy, completeness, or suitability of any content or products presented. Nothing on this website should be construed as legal, tax, investment, financial, medical, or other professional advice. In addition, no part of this site—including articles or product references—constitutes a solicitation, recommendation, endorsement, advertisement, or offer to buy or sell any securities, franchises, or other financial instruments, particularly in jurisdictions where such activity would be unlawful.
All content is of a general nature and may not address the specific circumstances of any individual or entity. It is not a substitute for professional advice or services. Any actions you take based on the information provided here are strictly at your own risk. You accept full responsibility for any decisions or outcomes arising from your use of this website and agree to release us from any liability in connection with your use of, or reliance upon, the content or products found herein.