
|
Prudent Corporate Advisory Services Limited (Prudent.NS) Évaluation DCF |
Entièrement Modifiable: Adapté À Vos Besoins Dans Excel Ou Sheets
Conception Professionnelle: Modèles Fiables Et Conformes Aux Normes Du Secteur
Pré-Construits Pour Une Utilisation Rapide Et Efficace
Compatible MAC/PC, entièrement débloqué
Aucune Expertise N'Est Requise; Facile À Suivre
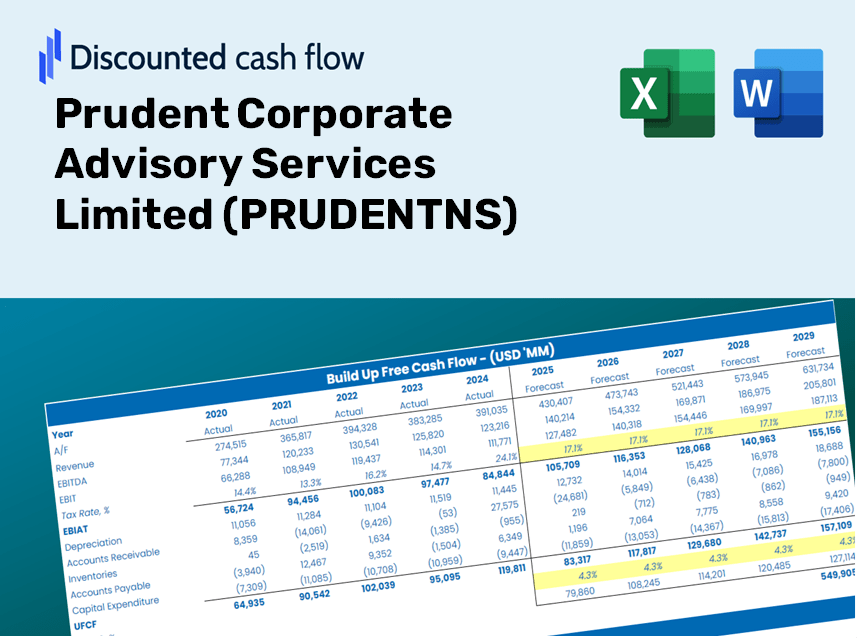
Prudent Corporate Advisory Services Limited (PRUDENT.NS) Bundle
Conçu pour la précision, notre calculatrice DCF (Prudentns) vous permet d'évaluer l'évaluation de Prudent Corporate Advisory Services Limited à l'aide de données financières réelles, tout en offrant une flexibilité complète pour modifier tous les paramètres clés pour des projections améliorées.
Discounted Cash Flow (DCF) - (USD MM)
| Year | AY1 2021 |
AY2 2022 |
AY3 2023 |
AY4 2024 |
AY5 2025 |
FY1 2026 |
FY2 2027 |
FY3 2028 |
FY4 2029 |
FY5 2030 |
|---|---|---|---|---|---|---|---|---|---|---|
| Revenue | 2,775.6 | 4,427.8 | 6,190.1 | 8,225.6 | 11,311.1 | 16,110.5 | 22,946.3 | 32,682.6 | 46,550.1 | 66,301.6 |
| Revenue Growth, % | 0 | 59.53 | 39.8 | 32.88 | 37.51 | 42.43 | 42.43 | 42.43 | 42.43 | 42.43 |
| EBITDA | 701.8 | 1,235.0 | 1,825.5 | 2,145.5 | 2,946.3 | 4,343.4 | 6,186.3 | 8,811.2 | 12,549.9 | 17,874.8 |
| EBITDA, % | 25.29 | 27.89 | 29.49 | 26.08 | 26.05 | 26.96 | 26.96 | 26.96 | 26.96 | 26.96 |
| Depreciation | 81.2 | 133.9 | 240.3 | 248.2 | 278.6 | 493.4 | 702.7 | 1,000.9 | 1,425.6 | 2,030.4 |
| Depreciation, % | 2.93 | 3.02 | 3.88 | 3.02 | 2.46 | 3.06 | 3.06 | 3.06 | 3.06 | 3.06 |
| EBIT | 620.7 | 1,101.1 | 1,585.2 | 1,897.3 | 2,667.7 | 3,850.0 | 5,483.6 | 7,810.3 | 11,124.3 | 15,844.4 |
| EBIT, % | 22.36 | 24.87 | 25.61 | 23.07 | 23.58 | 23.9 | 23.9 | 23.9 | 23.9 | 23.9 |
| Total Cash | 993.3 | 921.3 | 774.7 | 3,096.7 | 5,441.4 | 4,989.9 | 7,107.1 | 10,122.7 | 14,417.8 | 20,535.4 |
| Total Cash, percent | .0 | .0 | .0 | .0 | .0 | .0 | .0 | .0 | .0 | .0 |
| Account Receivables | 728.0 | 992.1 | 1,051.8 | 6.9 | 1,566.6 | 2,563.5 | 3,651.2 | 5,200.4 | 7,407.0 | 10,549.9 |
| Account Receivables, % | 26.23 | 22.41 | 16.99 | 0.08384759 | 13.85 | 15.91 | 15.91 | 15.91 | 15.91 | 15.91 |
| Inventories | .0 | .0 | .0 | .0 | .0 | .0 | .0 | .0 | .0 | .0 |
| Inventories, % | 0 | 0 | 0 | 0 | 0 | 0 | 0 | 0 | 0 | 0 |
| Accounts Payable | 939.4 | 1,205.6 | 1,165.2 | 2,048.1 | 1,690.0 | 3,858.0 | 5,495.0 | 7,826.5 | 11,147.4 | 15,877.2 |
| Accounts Payable, % | 33.84 | 27.23 | 18.82 | 24.9 | 14.94 | 23.95 | 23.95 | 23.95 | 23.95 | 23.95 |
| Capital Expenditure | -17.1 | -17.9 | -18.2 | -48.2 | -179.0 | -112.2 | -159.9 | -227.7 | -324.3 | -461.9 |
| Capital Expenditure, % | -0.61501 | -0.40523 | -0.29453 | -0.58569 | -1.58 | -0.69666 | -0.69666 | -0.69666 | -0.69666 | -0.69666 |
| Tax Rate, % | 25.35 | 25.35 | 25.35 | 25.35 | 25.35 | 25.35 | 25.35 | 25.35 | 25.35 | 25.35 |
| EBITAT | 464.5 | 825.9 | 1,179.5 | 1,416.6 | 1,991.4 | 2,876.5 | 4,097.0 | 5,835.4 | 8,311.4 | 11,837.9 |
| Depreciation | ||||||||||
| Changes in Account Receivables | ||||||||||
| Changes in Inventories | ||||||||||
| Changes in Accounts Payable | ||||||||||
| Capital Expenditure | ||||||||||
| UFCF | 740.0 | 944.1 | 1,301.4 | 3,544.4 | 173.1 | 4,428.7 | 5,189.1 | 7,390.9 | 10,526.9 | 14,993.5 |
| WACC, % | 5.07 | 5.07 | 5.07 | 5.07 | 5.07 | 5.07 | 5.07 | 5.07 | 5.07 | 5.07 |
| PV UFCF | ||||||||||
| SUM PV UFCF | 35,629.6 | |||||||||
| Long Term Growth Rate, % | 2.00 | |||||||||
| Free cash flow (T + 1) | 15,293 | |||||||||
| Terminal Value | 497,643 | |||||||||
| Present Terminal Value | 388,560 | |||||||||
| Enterprise Value | 424,190 | |||||||||
| Net Debt | 120 | |||||||||
| Equity Value | 424,070 | |||||||||
| Diluted Shares Outstanding, MM | 41 | |||||||||
| Equity Value Per Share | 10,241.76 |
Benefits You Will Gain
- Genuine PRUDENTNS Financial Data: Access both historical and projected figures for precise valuation.
- Customizable Parameters: Adjust inputs such as WACC, tax rates, revenue growth, and capital expenditures.
- Automated Calculations: Intrinsic value and NPV are computed in real-time.
- Scenario Testing: Explore various scenarios to assess the future performance of Prudent Corporate Advisory Services Limited.
- User-Friendly Design: Crafted for professionals while remaining accessible to newcomers.
Key Features
- Comprehensive DCF Calculator: Offers detailed unlevered and levered DCF valuation models tailored for Prudent Corporate Advisory Services Limited (PRUDENTNS).
- WACC Calculator: Features a pre-configured Weighted Average Cost of Capital sheet with adjustable inputs.
- Customizable Forecast Assumptions: Easily update growth rates, capital expenditures, and discount rates as needed.
- Integrated Financial Ratios: Evaluate profitability, leverage, and efficiency ratios specifically for Prudent Corporate Advisory Services Limited (PRUDENTNS).
- Dashboard and Visual Charts: Visual representations of key valuation metrics for streamlined analysis.
How It Functions
- Download: Obtain the pre-built Excel file featuring Prudent Corporate Advisory Services Limited’s (PRUDENTNS) financial metrics.
- Customize: Modify your forecasts, such as revenue growth rates, EBITDA percentages, and WACC values.
- Update Automatically: The intrinsic value and NPV calculations refresh in real-time.
- Test Scenarios: Develop various projections and instantly evaluate the outcomes.
- Make Decisions: Leverage the valuation data to inform your investment tactics.
Why Opt for This Calculator?
- Precise Data: Utilize authentic Prudent Corporate Advisory Services Limited (PRUDENTNS) financials for trustworthy valuation outcomes.
- Tailorable: Modify essential parameters such as growth rates, WACC, and tax rates to align with your forecasts.
- Efficient: Ready-made calculations save you the hassle of building from the ground up.
- Expert-Level Tool: Crafted for investors, analysts, and consultants in the field.
- Easy to Use: With a user-friendly design and guided instructions, it's accessible for everyone.
Who Can Benefit from PRUDENTNS?
- Investors: Evaluate the valuation of Prudent Corporate Advisory Services Limited (PRUDENTNS) before making investment decisions.
- CFOs and Financial Analysts: Enhance valuation methodologies and assess financial projections effectively.
- Startup Founders: Understand the valuation frameworks of leading advisory firms like PRUDENTNS.
- Consultants: Create comprehensive valuation reports to serve your clients’ needs.
- Students and Educators: Utilize current data to teach and practice valuation skills in real-world scenarios.
What the Template Includes
- Preloaded PRUDENTNS Data: Historical and projected financial metrics, encompassing revenue, EBIT, and capital expenditures.
- DCF and WACC Models: Professional-grade templates for determining intrinsic value and Weighted Average Cost of Capital.
- Customizable Inputs: Yellow-highlighted fields for modifying revenue growth, tax rates, and discount rates.
- Financial Statements: Detailed annual and quarterly financial statements for in-depth analysis.
- Key Ratios: Metrics on profitability, leverage, and efficiency for performance evaluation.
- Dashboard and Visualizations: Graphical representations of valuation results and underlying assumptions.
Disclaimer
All information, articles, and product details provided on this website are for general informational and educational purposes only. We do not claim any ownership over, nor do we intend to infringe upon, any trademarks, copyrights, logos, brand names, or other intellectual property mentioned or depicted on this site. Such intellectual property remains the property of its respective owners, and any references here are made solely for identification or informational purposes, without implying any affiliation, endorsement, or partnership.
We make no representations or warranties, express or implied, regarding the accuracy, completeness, or suitability of any content or products presented. Nothing on this website should be construed as legal, tax, investment, financial, medical, or other professional advice. In addition, no part of this site—including articles or product references—constitutes a solicitation, recommendation, endorsement, advertisement, or offer to buy or sell any securities, franchises, or other financial instruments, particularly in jurisdictions where such activity would be unlawful.
All content is of a general nature and may not address the specific circumstances of any individual or entity. It is not a substitute for professional advice or services. Any actions you take based on the information provided here are strictly at your own risk. You accept full responsibility for any decisions or outcomes arising from your use of this website and agree to release us from any liability in connection with your use of, or reliance upon, the content or products found herein.