
|
Prospect Capital Corporation (PSEC) Évaluation DCF |
Entièrement Modifiable: Adapté À Vos Besoins Dans Excel Ou Sheets
Conception Professionnelle: Modèles Fiables Et Conformes Aux Normes Du Secteur
Pré-Construits Pour Une Utilisation Rapide Et Efficace
Compatible MAC/PC, entièrement débloqué
Aucune Expertise N'Est Requise; Facile À Suivre
Prospect Capital Corporation (PSEC) Bundle
Améliorez vos stratégies d'investissement avec la calculatrice DCF de Prospect Capital Corporation (PSEC)! Explorez les données financières réelles, ajustez les prévisions et les dépenses de croissance et observez instantanément comment ces changements affectent la valeur intrinsèque du PSEC.
Discounted Cash Flow (DCF) - (USD MM)
| Year | AY1 2021 |
AY2 2022 |
AY3 2023 |
AY4 2024 |
AY5 2025 |
FY1 2026 |
FY2 2027 |
FY3 2028 |
FY4 2029 |
FY5 2030 |
|---|---|---|---|---|---|---|---|---|---|---|
| Revenue | 1,147.7 | 739.9 | 87.3 | 467.4 | -276.8 | -191.2 | -132.1 | -91.2 | -63.0 | -43.5 |
| Revenue Growth, % | 0 | -35.53 | -88.2 | 435.32 | -159.23 | -30.93 | -30.93 | -30.93 | -30.93 | -30.93 |
| EBITDA | 963.8 | 582.6 | -101.6 | 262.8 | -469.9 | -83.7 | -57.8 | -39.9 | -27.6 | -19.1 |
| EBITDA, % | 83.98 | 78.74 | -116.42 | 56.24 | 169.75 | 43.79 | 43.79 | 43.79 | 43.79 | 43.79 |
| Depreciation | .0 | .0 | .0 | .0 | .0 | .0 | .0 | .0 | .0 | .0 |
| Depreciation, % | 0 | 0 | 0 | 0 | 0 | 0 | 0 | 0 | 0 | 0 |
| EBIT | 963.8 | 582.6 | -101.6 | 262.8 | -469.9 | -83.7 | -57.8 | -39.9 | -27.6 | -19.1 |
| EBIT, % | 83.98 | 78.74 | -116.42 | 56.24 | 169.75 | 43.79 | 43.79 | 43.79 | 43.79 | 43.79 |
| Total Cash | 63.6 | 31.2 | 90.6 | 81.9 | 46.5 | -42.2 | -29.2 | -20.2 | -13.9 | -9.6 |
| Total Cash, percent | .0 | .0 | .0 | .0 | .0 | .0 | .0 | .0 | .0 | .0 |
| Account Receivables | 25.5 | 13.7 | 24.4 | 28.8 | 60.3 | -6.3 | -4.3 | -3.0 | -2.1 | -1.4 |
| Account Receivables, % | 2.22 | 1.85 | 27.92 | 6.17 | -21.78 | 3.27 | 3.27 | 3.27 | 3.27 | 3.27 |
| Inventories | .0 | .0 | .0 | .0 | .0 | .0 | .0 | .0 | .0 | .0 |
| Inventories, % | 0 | 0 | 0 | 0 | 0 | 0 | 0 | 0 | 0 | 0 |
| Accounts Payable | 50.7 | 50.3 | 53.7 | 47.1 | 44.0 | -25.6 | -17.7 | -12.2 | -8.4 | -5.8 |
| Accounts Payable, % | 4.42 | 6.8 | 61.53 | 10.08 | -15.88 | 13.39 | 13.39 | 13.39 | 13.39 | 13.39 |
| Capital Expenditure | .0 | .0 | .0 | .0 | .0 | .0 | .0 | .0 | .0 | .0 |
| Capital Expenditure, % | 0 | 0 | 0 | 0 | 0 | 0 | 0 | 0 | 0 | 0 |
| Tax Rate, % | 0 | 0 | 0 | 0 | 0 | 0 | 0 | 0 | 0 | 0 |
| EBITAT | 963.8 | 582.6 | -101.6 | 262.8 | -469.9 | -83.7 | -57.8 | -39.9 | -27.6 | -19.1 |
| Depreciation | ||||||||||
| Changes in Account Receivables | ||||||||||
| Changes in Inventories | ||||||||||
| Changes in Accounts Payable | ||||||||||
| Capital Expenditure | ||||||||||
| UFCF | 989.0 | 594.1 | -109.0 | 251.7 | -504.5 | -86.7 | -51.8 | -35.8 | -24.7 | -17.1 |
| WACC, % | 6.78 | 6.78 | 6.78 | 6.78 | 6.78 | 6.78 | 6.78 | 6.78 | 6.78 | 6.78 |
| PV UFCF | ||||||||||
| SUM PV UFCF | -187.4 | |||||||||
| Long Term Growth Rate, % | 2.00 | |||||||||
| Free cash flow (T + 1) | -17 | |||||||||
| Terminal Value | -364 | |||||||||
| Present Terminal Value | -262 | |||||||||
| Enterprise Value | -450 | |||||||||
| Net Debt | 2,042 | |||||||||
| Equity Value | -2,492 | |||||||||
| Diluted Shares Outstanding, MM | 440 | |||||||||
| Equity Value Per Share | -5.66 |
What You Will Receive
- Customizable Excel Template: A fully editable Excel-based DCF Calculator featuring pre-filled financial data for Prospect Capital Corporation (PSEC).
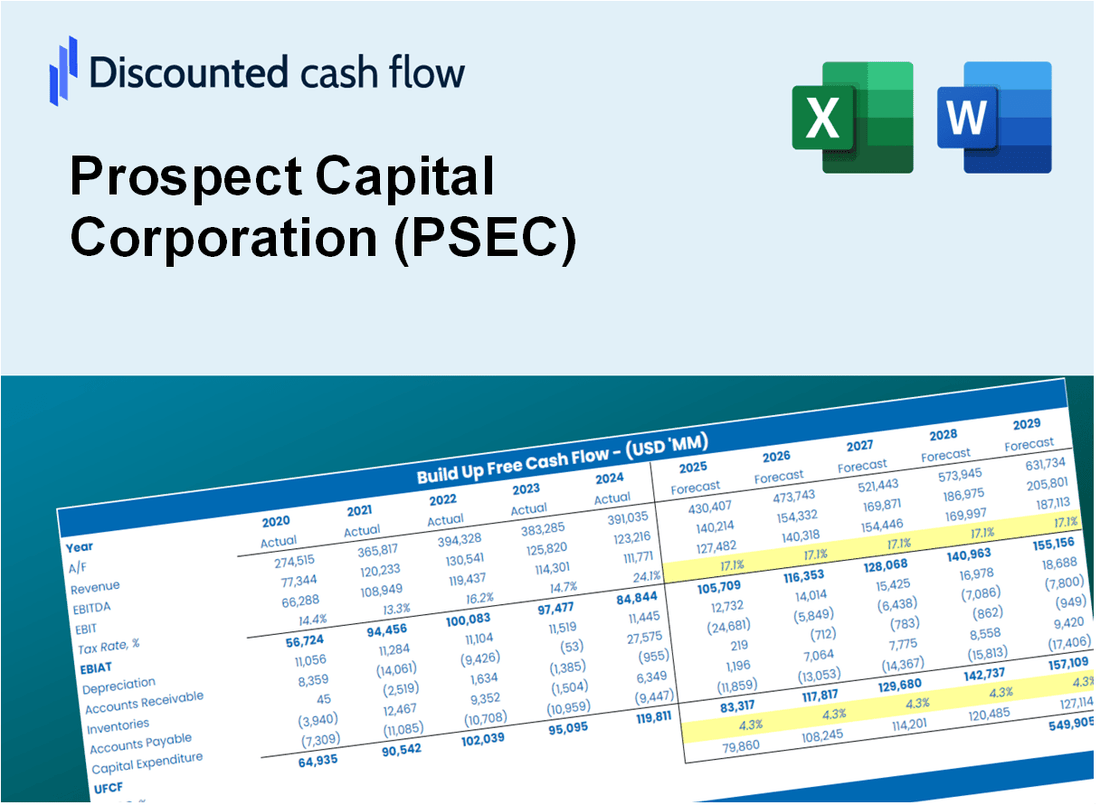
- Accurate Data: Historical performance metrics and future projections (highlighted in the yellow cells).
- Assumption Adjustability: Modify key forecast parameters such as revenue growth, EBITDA %, and WACC.
- Instant Calculations: Quickly observe how your inputs affect the valuation of Prospect Capital Corporation (PSEC).
- Professional Resource: Designed for investors, CFOs, consultants, and financial analysts.
- Intuitive Layout: Organized for simplicity and ease of navigation, complete with step-by-step guidance.
Key Features
- Real-Time PSEC Data: Pre-loaded with Prospect Capital Corporation's historical financials and future projections.
- Comprehensive Customization: Modify revenue growth, profit margins, discount rates, tax obligations, and capital expenditures.
- Interactive Valuation Model: Instant updates to Net Present Value (NPV) and intrinsic value based on your adjustments.
- Scenario Analysis: Develop various forecasting scenarios to evaluate different valuation results.
- Intuitive User Interface: Clean, organized, and crafted for both industry professionals and newcomers.
How It Works
- Download the Template: Gain immediate access to the Excel-based PSEC DCF Calculator.
- Input Your Assumptions: Modify the yellow-highlighted cells for growth rates, WACC, margins, and other variables.
- Instant Calculations: The model automatically recalculates Prospect Capital Corporation’s intrinsic value.
- Test Scenarios: Experiment with various assumptions to assess potential changes in valuation.
- Analyze and Decide: Utilize the findings to inform your investment or financial strategy.
Why Choose This Calculator for Prospect Capital Corporation (PSEC)?
- Designed for Investors: A specialized tool tailored for asset managers, analysts, and financial advisors.
- Comprehensive Data: Prospect Capital Corporation’s historical and projected financials are preloaded for precision.
- Flexible Scenario Analysis: Effortlessly test various forecasts and assumptions.
- Insightful Outputs: Instantly computes intrinsic value, NPV, and essential financial metrics.
- User-Friendly: Step-by-step guidance simplifies the calculation process.
Who Should Use This Product?
- Investors: Accurately assess Prospect Capital Corporation's (PSEC) fair value prior to making investment choices.
- CFOs: Utilize a high-quality DCF model for comprehensive financial reporting and analysis of (PSEC).
- Consultants: Easily modify the template for valuation reports tailored to clients focusing on (PSEC).
- Entrepreneurs: Discover financial modeling techniques employed by leading firms, including insights relevant to (PSEC).
- Educators: Implement it as a teaching resource to illustrate various valuation methodologies applicable to (PSEC).
What the Template Contains
- Historical Data: Includes Prospect Capital Corporation’s (PSEC) past financials and baseline forecasts.
- DCF and Levered DCF Models: Detailed templates to calculate Prospect Capital Corporation’s (PSEC) intrinsic value.
- WACC Sheet: Pre-built calculations for Weighted Average Cost of Capital.
- Editable Inputs: Modify key drivers like growth rates, EBITDA %, and CAPEX assumptions.
- Quarterly and Annual Statements: A complete breakdown of Prospect Capital Corporation’s (PSEC) financials.
- Interactive Dashboard: Visualize valuation results and projections dynamically.
Disclaimer
All information, articles, and product details provided on this website are for general informational and educational purposes only. We do not claim any ownership over, nor do we intend to infringe upon, any trademarks, copyrights, logos, brand names, or other intellectual property mentioned or depicted on this site. Such intellectual property remains the property of its respective owners, and any references here are made solely for identification or informational purposes, without implying any affiliation, endorsement, or partnership.
We make no representations or warranties, express or implied, regarding the accuracy, completeness, or suitability of any content or products presented. Nothing on this website should be construed as legal, tax, investment, financial, medical, or other professional advice. In addition, no part of this site—including articles or product references—constitutes a solicitation, recommendation, endorsement, advertisement, or offer to buy or sell any securities, franchises, or other financial instruments, particularly in jurisdictions where such activity would be unlawful.
All content is of a general nature and may not address the specific circumstances of any individual or entity. It is not a substitute for professional advice or services. Any actions you take based on the information provided here are strictly at your own risk. You accept full responsibility for any decisions or outcomes arising from your use of this website and agree to release us from any liability in connection with your use of, or reliance upon, the content or products found herein.