
|
PlayTech plc (PTEC.L) Valation DCF |
Entièrement Modifiable: Adapté À Vos Besoins Dans Excel Ou Sheets
Conception Professionnelle: Modèles Fiables Et Conformes Aux Normes Du Secteur
Pré-Construits Pour Une Utilisation Rapide Et Efficace
Compatible MAC/PC, entièrement débloqué
Aucune Expertise N'Est Requise; Facile À Suivre
Playtech plc (PTEC.L) Bundle
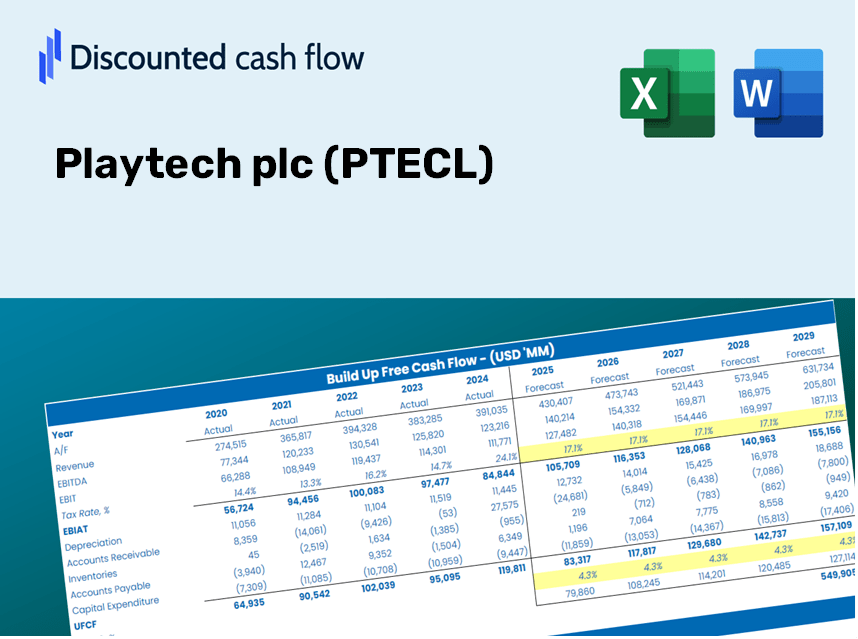
Simplifiez l'évaluation PlayTech PLC avec cette calculatrice DCF personnalisable! Doté de Real PlayTech PLC Financials et des entrées de prévisions réglables, vous pouvez tester les scénarios et découvrir la juste valeur de PlayTech plc en minutes.
Discounted Cash Flow (DCF) - (USD MM)
| Year | AY1 2020 |
AY2 2021 |
AY3 2022 |
AY4 2023 |
AY5 2024 |
FY1 2025 |
FY2 2026 |
FY3 2027 |
FY4 2028 |
FY5 2029 |
|---|---|---|---|---|---|---|---|---|---|---|
| Revenue | 947.7 | 1,059.2 | 1,407.6 | 678.3 | 745.2 | 750.2 | 755.3 | 760.4 | 765.5 | 770.7 |
| Revenue Growth, % | 0 | 11.77 | 32.89 | -51.81 | 9.86 | 0.675 | 0.675 | 0.675 | 0.675 | 0.675 |
| EBITDA | 147.9 | 184.7 | 255.6 | 145.1 | 118.1 | 132.7 | 133.6 | 134.5 | 135.4 | 136.3 |
| EBITDA, % | 15.61 | 17.44 | 18.16 | 21.39 | 15.85 | 17.69 | 17.69 | 17.69 | 17.69 | 17.69 |
| Depreciation | 117.3 | 86.1 | 86.7 | 106.2 | 97.5 | 83.1 | 83.7 | 84.2 | 84.8 | 85.4 |
| Depreciation, % | 12.38 | 8.13 | 6.16 | 15.65 | 13.08 | 11.08 | 11.08 | 11.08 | 11.08 | 11.08 |
| EBIT | 30.6 | 98.6 | 168.9 | 38.9 | 20.7 | 49.6 | 49.9 | 50.3 | 50.6 | 50.9 |
| EBIT, % | 3.23 | 9.31 | 12 | 5.74 | 2.77 | 6.61 | 6.61 | 6.61 | 6.61 | 6.61 |
| Total Cash | 600.8 | 505.6 | 374.8 | 453.6 | 235.6 | 354.5 | 356.9 | 359.3 | 361.7 | 364.1 |
| Total Cash, percent | .0 | .0 | .0 | .0 | .0 | .0 | .0 | .0 | .0 | .0 |
| Account Receivables | 134.6 | 156.9 | 144.0 | 197.1 | 135.3 | 129.7 | 130.6 | 131.5 | 132.4 | 133.3 |
| Account Receivables, % | 14.2 | 14.81 | 10.23 | 29.06 | 18.16 | 17.29 | 17.29 | 17.29 | 17.29 | 17.29 |
| Inventories | 4.1 | 4.3 | 4.8 | 6.0 | 6.1 | 4.3 | 4.4 | 4.4 | 4.4 | 4.4 |
| Inventories, % | 0.43579 | 0.4065 | 0.34336 | 0.88094 | 0.81368 | 0.57606 | 0.57606 | 0.57606 | 0.57606 | 0.57606 |
| Accounts Payable | 30.8 | 29.4 | 53.8 | 58.8 | 54.1 | 38.7 | 38.9 | 39.2 | 39.5 | 39.7 |
| Accounts Payable, % | 3.25 | 2.78 | 3.82 | 8.67 | 7.26 | 5.16 | 5.16 | 5.16 | 5.16 | 5.16 |
| Capital Expenditure | -105.0 | -100.4 | -110.2 | -131.8 | -136.9 | -99.3 | -100.0 | -100.6 | -101.3 | -102.0 |
| Capital Expenditure, % | -11.08 | -9.47 | -7.83 | -19.43 | -18.37 | -13.24 | -13.24 | -13.24 | -13.24 | -13.24 |
| Tax Rate, % | -154.26 | -154.26 | -154.26 | -154.26 | -154.26 | -154.26 | -154.26 | -154.26 | -154.26 | -154.26 |
| EBITAT | 172.5 | 109.9 | 154.8 | 58.1 | 52.5 | 48.7 | 49.1 | 49.4 | 49.7 | 50.1 |
| Depreciation | ||||||||||
| Changes in Account Receivables | ||||||||||
| Changes in Inventories | ||||||||||
| Changes in Accounts Payable | ||||||||||
| Capital Expenditure | ||||||||||
| UFCF | 76.9 | 71.9 | 167.9 | -16.8 | 70.1 | 24.5 | 32.1 | 32.4 | 32.6 | 32.8 |
| WACC, % | 6.77 | 6.77 | 6.53 | 6.77 | 6.77 | 6.72 | 6.72 | 6.72 | 6.72 | 6.72 |
| PV UFCF | ||||||||||
| SUM PV UFCF | 126.6 | |||||||||
| Long Term Growth Rate, % | 3.00 | |||||||||
| Free cash flow (T + 1) | 34 | |||||||||
| Terminal Value | 908 | |||||||||
| Present Terminal Value | 656 | |||||||||
| Enterprise Value | 782 | |||||||||
| Net Debt | 199 | |||||||||
| Equity Value | 584 | |||||||||
| Diluted Shares Outstanding, MM | 305 | |||||||||
| Equity Value Per Share | 191.16 |
What You'll Receive
- Genuine PTECL Financial Data: Pre-populated with Playtech’s historical and projected figures for detailed analysis.
- Completely Customizable Template: Easily adjust essential inputs such as revenue growth, WACC, and EBITDA percentage.
- Instant Calculations: Automatically see Playtech’s intrinsic value update in real-time as you make adjustments.
- Professional Valuation Tool: Crafted for investors, analysts, and consultants in need of precise DCF evaluations.
- Intuitive User Interface: Organized layout and straightforward guidance suitable for users of all skill levels.
Key Features
- Pre-Loaded Data: Playtech plc’s historical financial statements and pre-filled forecasts.
- Fully Adjustable Inputs: Customize WACC, tax rates, revenue growth, and EBITDA margins.
- Instant Results: View Playtech plc's intrinsic value recalculated in real time.
- Clear Visual Outputs: Dashboard charts present valuation results and essential metrics.
- Built for Accuracy: A professional tool designed for analysts, investors, and finance professionals.
How It Operates
- Download: Obtain the pre-configured Excel file containing Playtech plc's (PTECL) financial data.
- Customize: Tailor forecasts such as revenue growth, EBITDA percentage, and WACC to your needs.
- Update Automatically: The intrinsic value and NPV calculations refresh in real-time.
- Test Scenarios: Generate various projections and assess outcomes immediately.
- Make Decisions: Utilize the valuation insights to inform your investment strategy.
Why Opt for This Calculator?
- Designed for Experts: A sophisticated tool utilized by analysts, CFOs, and financial consultants.
- Accurate Data: Playtech plc’s (PTECL) historical and projected financial information preloaded for precision.
- Flexible Forecasting: Effortlessly test various scenarios and assumptions.
- Clear Results: Automatically computes intrinsic value, NPV, and essential metrics.
- User-Friendly: Step-by-step guidance ensures a smooth calculation process.
Who Can Benefit from Playtech plc (PTECL)?
- Investors: Make informed investment decisions with our advanced valuation tools.
- Financial Analysts: Enhance efficiency with our customizable DCF model at your fingertips.
- Consultants: Seamlessly modify templates for impactful client presentations or reports.
- Finance Enthusiasts: Broaden your knowledge of valuation methodologies through practical examples.
- Educators and Students: Utilize this resource as an essential tool for finance education.
Contents of the Template
- Pre-Filled DCF Model: Playtech plc’s financial data preloaded for immediate utilization.
- WACC Calculator: Comprehensive calculations for Weighted Average Cost of Capital.
- Financial Ratios: Assess Playtech plc’s profitability, leverage, and operational efficiency.
- Editable Inputs: Modify assumptions such as growth rates, profit margins, and capital expenditures to suit your analysis.
- Financial Statements: Annual and quarterly reports to facilitate in-depth evaluation.
- Interactive Dashboard: Effortlessly visualize essential valuation metrics and outcomes.
Disclaimer
All information, articles, and product details provided on this website are for general informational and educational purposes only. We do not claim any ownership over, nor do we intend to infringe upon, any trademarks, copyrights, logos, brand names, or other intellectual property mentioned or depicted on this site. Such intellectual property remains the property of its respective owners, and any references here are made solely for identification or informational purposes, without implying any affiliation, endorsement, or partnership.
We make no representations or warranties, express or implied, regarding the accuracy, completeness, or suitability of any content or products presented. Nothing on this website should be construed as legal, tax, investment, financial, medical, or other professional advice. In addition, no part of this site—including articles or product references—constitutes a solicitation, recommendation, endorsement, advertisement, or offer to buy or sell any securities, franchises, or other financial instruments, particularly in jurisdictions where such activity would be unlawful.
All content is of a general nature and may not address the specific circumstances of any individual or entity. It is not a substitute for professional advice or services. Any actions you take based on the information provided here are strictly at your own risk. You accept full responsibility for any decisions or outcomes arising from your use of this website and agree to release us from any liability in connection with your use of, or reliance upon, the content or products found herein.