
|
Qinetiq Group PLC (QQ.L) Évaluation DCF |
Entièrement Modifiable: Adapté À Vos Besoins Dans Excel Ou Sheets
Conception Professionnelle: Modèles Fiables Et Conformes Aux Normes Du Secteur
Pré-Construits Pour Une Utilisation Rapide Et Efficace
Compatible MAC/PC, entièrement débloqué
Aucune Expertise N'Est Requise; Facile À Suivre
QinetiQ Group plc (QQ.L) Bundle
Explorez les perspectives financières de Qinetiq Group plc (QQL) avec notre calculatrice DCF conviviale! Entrez vos hypothèses concernant la croissance, les marges et les coûts pour calculer la valeur intrinsèque de Qinetiq Group plc (QQL) et améliorez votre stratégie d'investissement.
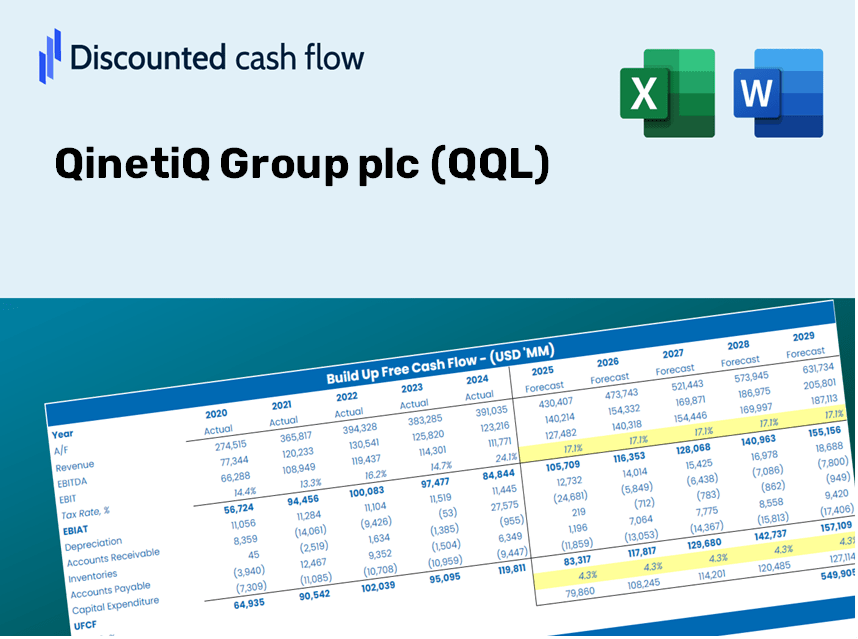
Discounted Cash Flow (DCF) - (USD MM)
| Year | AY1 2021 |
AY2 2022 |
AY3 2023 |
AY4 2024 |
AY5 2025 |
FY1 2026 |
FY2 2027 |
FY3 2028 |
FY4 2029 |
FY5 2030 |
|---|---|---|---|---|---|---|---|---|---|---|
| Revenue | 1,278.2 | 1,320.4 | 1,580.7 | 1,912.1 | 1,931.6 | 2,148.9 | 2,390.7 | 2,659.6 | 2,958.8 | 3,291.7 |
| Revenue Growth, % | 0 | 3.3 | 19.71 | 20.97 | 1.02 | 11.25 | 11.25 | 11.25 | 11.25 | 11.25 |
| EBITDA | 205.6 | 176.6 | 226.7 | 292.9 | 26.2 | 259.9 | 289.2 | 321.7 | 357.9 | 398.1 |
| EBITDA, % | 16.09 | 13.37 | 14.34 | 15.32 | 1.36 | 12.1 | 12.1 | 12.1 | 12.1 | 12.1 |
| Depreciation | 61.2 | 62.3 | 74.6 | 90.7 | 110.5 | 106.1 | 118.0 | 131.3 | 146.1 | 162.5 |
| Depreciation, % | 4.79 | 4.72 | 4.72 | 4.74 | 5.72 | 4.94 | 4.94 | 4.94 | 4.94 | 4.94 |
| EBIT | 144.4 | 114.3 | 152.1 | 202.2 | -84.3 | 153.8 | 171.1 | 190.4 | 211.8 | 235.6 |
| EBIT, % | 11.3 | 8.66 | 9.62 | 10.57 | -4.36 | 7.16 | 7.16 | 7.16 | 7.16 | 7.16 |
| Total Cash | 190.6 | 248.3 | 155.6 | 231.0 | 290.6 | 303.8 | 338.0 | 376.0 | 418.3 | 465.4 |
| Total Cash, percent | .0 | .0 | .0 | .0 | .0 | .0 | .0 | .0 | .0 | .0 |
| Account Receivables | 281.6 | 300.2 | 373.0 | 409.2 | 351.5 | 464.0 | 516.2 | 574.3 | 638.9 | 710.8 |
| Account Receivables, % | 22.03 | 22.74 | 23.6 | 21.4 | 18.2 | 21.59 | 21.59 | 21.59 | 21.59 | 21.59 |
| Inventories | 54.4 | 54.9 | 68.8 | 89.2 | 70.7 | 90.6 | 100.8 | 112.2 | 124.8 | 138.9 |
| Inventories, % | 4.26 | 4.16 | 4.35 | 4.67 | 3.66 | 4.22 | 4.22 | 4.22 | 4.22 | 4.22 |
| Accounts Payable | 77.3 | 76.1 | 135.9 | 175.9 | 152.1 | 161.1 | 179.2 | 199.4 | 221.8 | 246.8 |
| Accounts Payable, % | 6.05 | 5.76 | 8.6 | 9.2 | 7.87 | 7.5 | 7.5 | 7.5 | 7.5 | 7.5 |
| Capital Expenditure | -75.9 | -84.3 | -109.0 | -96.3 | -108.8 | -128.4 | -142.9 | -159.0 | -176.9 | -196.8 |
| Capital Expenditure, % | -5.94 | -6.38 | -6.9 | -5.04 | -5.63 | -5.98 | -5.98 | -5.98 | -5.98 | -5.98 |
| Tax Rate, % | -74.69 | -74.69 | -74.69 | -74.69 | -74.69 | -74.69 | -74.69 | -74.69 | -74.69 | -74.69 |
| EBITAT | 123.8 | 86.2 | 135.1 | 154.5 | -147.3 | 131.2 | 145.9 | 162.3 | 180.6 | 200.9 |
| Depreciation | ||||||||||
| Changes in Account Receivables | ||||||||||
| Changes in Inventories | ||||||||||
| Changes in Accounts Payable | ||||||||||
| Capital Expenditure | ||||||||||
| UFCF | -149.6 | 43.9 | 73.8 | 132.3 | -93.2 | -14.6 | 76.8 | 85.4 | 95.0 | 105.7 |
| WACC, % | 4.84 | 4.77 | 4.87 | 4.77 | 4.95 | 4.84 | 4.84 | 4.84 | 4.84 | 4.84 |
| PV UFCF | ||||||||||
| SUM PV UFCF | 292.2 | |||||||||
| Long Term Growth Rate, % | 2.00 | |||||||||
| Free cash flow (T + 1) | 108 | |||||||||
| Terminal Value | 3,796 | |||||||||
| Present Terminal Value | 2,997 | |||||||||
| Enterprise Value | 3,289 | |||||||||
| Net Debt | 138 | |||||||||
| Equity Value | 3,151 | |||||||||
| Diluted Shares Outstanding, MM | 571 | |||||||||
| Equity Value Per Share | 552.07 |
What You Will Receive
- Customizable Excel Template: A fully adjustable Excel-based DCF Calculator featuring pre-populated real QinetiQ Group plc (QQL) financial data.
- Tangible Data: Access to historical data and forward-looking estimates (highlighted in the yellow cells).
- Forecasting Flexibility: Modify key assumptions such as revenue growth, EBITDA %, and WACC.
- Instant Calculations: Immediately observe the effect of your inputs on the valuation of QinetiQ Group plc (QQL).
- Professional-grade Tool: Designed for investors, CFOs, consultants, and financial analysts.
- User-Friendly Interface: Organized for easy navigation and understanding, complete with step-by-step guidance.
Key Features
- Customizable Forecast Inputs: Adjust essential parameters such as revenue growth, EBITDA %, and capital expenditures tailored for QinetiQ Group plc (QQL).
- Instant DCF Valuation: Effortlessly calculates intrinsic value, NPV, and other financial metrics in real-time.
- Industry-Leading Precision: Leverages QinetiQ's actual financial performance for credible valuation results.
- Simplified Scenario Analysis: Easily evaluate various assumptions and analyze different outcomes.
- Efficient Valuation Tool: Streamlines the process, removing the need to create intricate valuation models from the ground up.
How It Functions
- Step 1: Download the Excel spreadsheet.
- Step 2: Examine the pre-filled financial data and projections for QinetiQ Group plc (QQL).
- Step 3: Adjust key parameters such as revenue growth, WACC, and tax rates (highlighted cells).
- Step 4: Observe the DCF model refresh in real-time as you modify inputs.
- Step 5: Evaluate the results and apply them to your investment strategies.
Why Opt for QinetiQ Group plc ([QQL])?
- Time-Saving: Skip the hassle of building a DCF model from the ground up – it's ready for immediate use.
- Enhanced Accuracy: Dependable financial data and formulas minimize valuation errors.
- Fully Customizable: Adapt the model to align with your specific assumptions and projections.
- User-Friendly: Intuitive charts and outputs make analyzing results straightforward.
- Endorsed by Professionals: Crafted for experts who prioritize both precision and ease of use.
Who Can Benefit from This Product?
- Institutional Investors: Develop comprehensive and accurate valuation models for assessing investments in QinetiQ Group plc (QQL).
- Corporate Finance Departments: Evaluate valuation scenarios to inform strategic decision-making within the organization.
- Consultants and Financial Advisors: Deliver precise valuation analyses and insights related to QinetiQ Group plc (QQL) for client recommendations.
- Academics and Students: Leverage real-world data to enhance learning and practice financial modeling techniques.
- Industry Enthusiasts: Gain insights into the market valuation of technology and defense companies like QinetiQ Group plc (QQL).
Contents of the Template
- Operating and Balance Sheet Data: Pre-filled historical data and forecasts for QinetiQ Group plc (QQL), including revenue, EBITDA, EBIT, and capital expenditures.
- WACC Calculation: A dedicated sheet for calculating the Weighted Average Cost of Capital (WACC) with parameters such as Beta, risk-free rate, and share price.
- DCF Valuation (Unlevered and Levered): Customizable Discounted Cash Flow models that display intrinsic value alongside comprehensive calculations.
- Financial Statements: Pre-loaded annual and quarterly financial statements to facilitate thorough analysis.
- Key Ratios: A collection of profitability, leverage, and efficiency ratios specific to QinetiQ Group plc (QQL).
- Dashboard and Charts: A visual overview of valuation outputs and assumptions for easy result analysis.
Disclaimer
All information, articles, and product details provided on this website are for general informational and educational purposes only. We do not claim any ownership over, nor do we intend to infringe upon, any trademarks, copyrights, logos, brand names, or other intellectual property mentioned or depicted on this site. Such intellectual property remains the property of its respective owners, and any references here are made solely for identification or informational purposes, without implying any affiliation, endorsement, or partnership.
We make no representations or warranties, express or implied, regarding the accuracy, completeness, or suitability of any content or products presented. Nothing on this website should be construed as legal, tax, investment, financial, medical, or other professional advice. In addition, no part of this site—including articles or product references—constitutes a solicitation, recommendation, endorsement, advertisement, or offer to buy or sell any securities, franchises, or other financial instruments, particularly in jurisdictions where such activity would be unlawful.
All content is of a general nature and may not address the specific circumstances of any individual or entity. It is not a substitute for professional advice or services. Any actions you take based on the information provided here are strictly at your own risk. You accept full responsibility for any decisions or outcomes arising from your use of this website and agree to release us from any liability in connection with your use of, or reliance upon, the content or products found herein.