
|
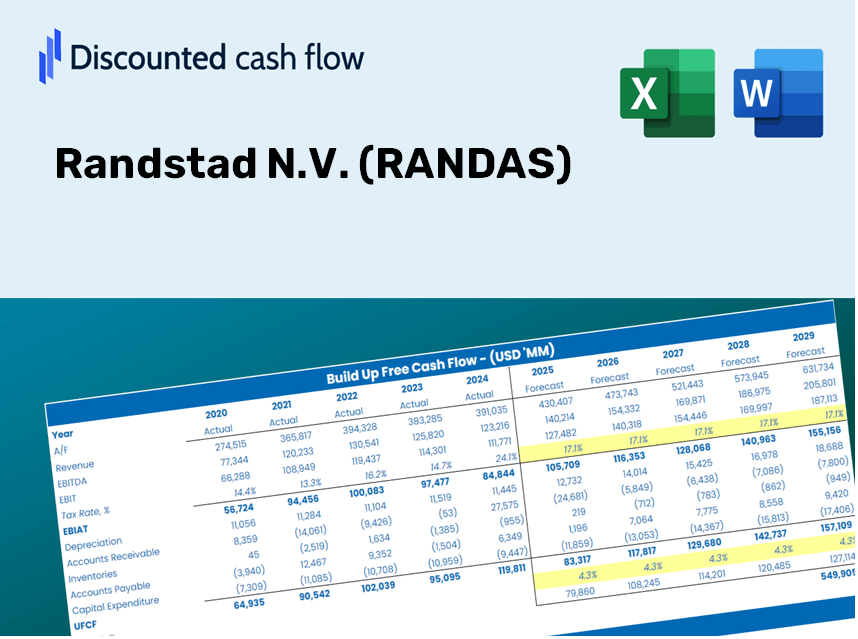
Randstad N.V. (Rand.as) Valation DCF |
Entièrement Modifiable: Adapté À Vos Besoins Dans Excel Ou Sheets
Conception Professionnelle: Modèles Fiables Et Conformes Aux Normes Du Secteur
Pré-Construits Pour Une Utilisation Rapide Et Efficace
Compatible MAC/PC, entièrement débloqué
Aucune Expertise N'Est Requise; Facile À Suivre
Randstad N.V. (RAND.AS) Bundle
Explorez les perspectives financières de Randstad N.V. (Randas) avec notre calculatrice DCF conviviale! Entrez vos projections pour la croissance, les marges et les dépenses pour calculer la valeur intrinsèque de Randstad N.V. (Randas) et affiner votre approche d'investissement.
Discounted Cash Flow (DCF) - (USD MM)
| Year | AY1 2020 |
AY2 2021 |
AY3 2022 |
AY4 2023 |
AY5 2024 |
FY1 2025 |
FY2 2026 |
FY3 2027 |
FY4 2028 |
FY5 2029 |
|---|---|---|---|---|---|---|---|---|---|---|
| Revenue | 20,718.0 | 24,635.0 | 27,568.0 | 25,426.0 | 24,122.0 | 25,202.3 | 26,330.9 | 27,510.1 | 28,742.2 | 30,029.3 |
| Revenue Growth, % | 0 | 18.91 | 11.91 | -7.77 | -5.13 | 4.48 | 4.48 | 4.48 | 4.48 | 4.48 |
| EBITDA | 798.0 | 1,384.0 | 1,473.0 | 1,169.0 | 633.0 | 1,110.7 | 1,160.4 | 1,212.4 | 1,266.7 | 1,323.4 |
| EBITDA, % | 3.85 | 5.62 | 5.34 | 4.6 | 2.62 | 4.41 | 4.41 | 4.41 | 4.41 | 4.41 |
| Depreciation | 402.0 | 340.0 | 309.0 | 325.0 | 351.0 | 361.6 | 377.8 | 394.8 | 412.4 | 430.9 |
| Depreciation, % | 1.94 | 1.38 | 1.12 | 1.28 | 1.46 | 1.43 | 1.43 | 1.43 | 1.43 | 1.43 |
| EBIT | 396.0 | 1,044.0 | 1,164.0 | 844.0 | 282.0 | 749.0 | 782.6 | 817.6 | 854.2 | 892.5 |
| EBIT, % | 1.91 | 4.24 | 4.22 | 3.32 | 1.17 | 2.97 | 2.97 | 2.97 | 2.97 | 2.97 |
| Total Cash | 474.0 | 859.0 | 274.0 | 261.0 | 357.0 | 467.5 | 488.4 | 510.3 | 533.2 | 557.1 |
| Total Cash, percent | .0 | .0 | .0 | .0 | .0 | .0 | .0 | .0 | .0 | .0 |
| Account Receivables | 3,652.0 | 4,482.0 | 4,780.0 | 4,394.0 | 5,173.0 | 4,631.5 | 4,838.9 | 5,055.6 | 5,282.0 | 5,518.6 |
| Account Receivables, % | 17.63 | 18.19 | 17.34 | 17.28 | 21.45 | 18.38 | 18.38 | 18.38 | 18.38 | 18.38 |
| Inventories | .0 | .0 | .0 | .0 | .0 | .0 | .0 | .0 | .0 | .0 |
| Inventories, % | 0 | 0 | 0 | 0 | 0 | 0 | 0 | 0 | 0 | 0 |
| Accounts Payable | 525.0 | 806.0 | 874.0 | 836.0 | 935.0 | 813.5 | 850.0 | 888.0 | 927.8 | 969.4 |
| Accounts Payable, % | 2.53 | 3.27 | 3.17 | 3.29 | 3.88 | 3.23 | 3.23 | 3.23 | 3.23 | 3.23 |
| Capital Expenditure | -106.0 | -128.0 | -122.0 | -93.0 | -84.0 | -110.3 | -115.2 | -120.4 | -125.8 | -131.4 |
| Capital Expenditure, % | -0.51163 | -0.51959 | -0.44254 | -0.36577 | -0.34823 | -0.43755 | -0.43755 | -0.43755 | -0.43755 | -0.43755 |
| Tax Rate, % | 35.26 | 35.26 | 35.26 | 35.26 | 35.26 | 35.26 | 35.26 | 35.26 | 35.26 | 35.26 |
| EBITAT | 330.7 | 787.6 | 960.4 | 691.1 | 182.6 | 581.4 | 607.4 | 634.6 | 663.0 | 692.7 |
| Depreciation | ||||||||||
| Changes in Account Receivables | ||||||||||
| Changes in Inventories | ||||||||||
| Changes in Accounts Payable | ||||||||||
| Capital Expenditure | ||||||||||
| UFCF | -2,500.3 | 450.6 | 917.4 | 1,271.1 | -230.4 | 1,252.8 | 699.0 | 730.3 | 763.1 | 797.2 |
| WACC, % | 6.73 | 6.64 | 6.72 | 6.71 | 6.52 | 6.66 | 6.66 | 6.66 | 6.66 | 6.66 |
| PV UFCF | ||||||||||
| SUM PV UFCF | 3,558.0 | |||||||||
| Long Term Growth Rate, % | 2.00 | |||||||||
| Free cash flow (T + 1) | 813 | |||||||||
| Terminal Value | 17,447 | |||||||||
| Present Terminal Value | 12,639 | |||||||||
| Enterprise Value | 16,197 | |||||||||
| Net Debt | 1,861 | |||||||||
| Equity Value | 14,336 | |||||||||
| Diluted Shares Outstanding, MM | 177 | |||||||||
| Equity Value Per Share | 80.95 |
What You Will Receive
- Pre-Filled Financial Model: Utilize Randstad N.V.'s actual data for accurate DCF valuation.
- Comprehensive Forecast Control: Modify revenue growth, profit margins, WACC, and other critical factors.
- Real-Time Calculations: Automatic updates provide immediate insights as you adjust parameters.
- Professionally Designed Template: A polished Excel file crafted for high-quality valuation needs.
- Flexible and Reusable: Customizable for easy adaptation, allowing for repeated use in detailed forecasting.
Key Features
- Comprehensive Historical Data: Access Randstad N.V.'s (RANDAS) financial statements and projections.
- Customizable Parameters: Modify WACC, tax rates, revenue growth, and EBITDA margins to fit your analysis.
- Real-Time Calculations: Instantly view the recalculated intrinsic value of Randstad N.V. (RANDAS).
- Intuitive Visuals: Dashboard graphics illustrate valuation outcomes and essential metrics.
- Designed for Precision: A reliable tool tailored for analysts, investors, and finance professionals.
How It Works
- Download: Obtain the pre-built Excel file featuring Randstad N.V. (RANDAS) financial data.
- Customize: Tailor forecasts such as revenue growth, EBITDA %, and WACC to your needs.
- Update Automatically: Watch the intrinsic value and NPV calculations refresh in real-time.
- Test Scenarios: Develop various projections and instantly compare the results.
- Make Decisions: Leverage the valuation insights to inform your investment strategy.
Why Choose the Randstad N.V. (RANDAS) Calculator?
- Reliable Data: Access to real Randstad financials ensures trustworthy valuation outcomes.
- Tailor-Made: Modify essential parameters such as growth rates, WACC, and tax rates to suit your forecasts.
- Efficient: Built-in calculations save you the hassle of starting from scratch.
- Professional Tool: Crafted for investors, analysts, and consultants specializing in Randstad.
- Easy to Use: A user-friendly interface with clear, step-by-step guidance, suitable for all users.
Who Can Benefit from Randstad N.V. (RANDAS)?
- Job Seekers: Gain access to a wide range of employment opportunities tailored to your skills.
- Employers: Streamline your hiring process with professional recruitment services designed for your needs.
- HR Professionals: Utilize expert resources to enhance your workforce management strategies.
- Industry Analysts: Analyze labor market trends and insights backed by extensive data from a leading provider.
- Students and Graduates: Explore internship and entry-level job options to kickstart your career journey.
What the Template Contains
- Pre-Filled DCF Model: Randstad N.V. (RANDAS) financial data preloaded for immediate use.
- WACC Calculator: Comprehensive calculations for the Weighted Average Cost of Capital.
- Financial Ratios: Assess Randstad N.V. (RANDAS) profitability, leverage, and efficiency.
- Editable Inputs: Modify assumptions such as growth, margins, and CAPEX to tailor your scenarios.
- Financial Statements: Annual and quarterly reports to facilitate in-depth analysis.
- Interactive Dashboard: Effortlessly visualize essential valuation metrics and outcomes.
Disclaimer
All information, articles, and product details provided on this website are for general informational and educational purposes only. We do not claim any ownership over, nor do we intend to infringe upon, any trademarks, copyrights, logos, brand names, or other intellectual property mentioned or depicted on this site. Such intellectual property remains the property of its respective owners, and any references here are made solely for identification or informational purposes, without implying any affiliation, endorsement, or partnership.
We make no representations or warranties, express or implied, regarding the accuracy, completeness, or suitability of any content or products presented. Nothing on this website should be construed as legal, tax, investment, financial, medical, or other professional advice. In addition, no part of this site—including articles or product references—constitutes a solicitation, recommendation, endorsement, advertisement, or offer to buy or sell any securities, franchises, or other financial instruments, particularly in jurisdictions where such activity would be unlawful.
All content is of a general nature and may not address the specific circumstances of any individual or entity. It is not a substitute for professional advice or services. Any actions you take based on the information provided here are strictly at your own risk. You accept full responsibility for any decisions or outcomes arising from your use of this website and agree to release us from any liability in connection with your use of, or reliance upon, the content or products found herein.