
|
RADCOM LTD. (RDCM) Évaluation DCF |
Entièrement Modifiable: Adapté À Vos Besoins Dans Excel Ou Sheets
Conception Professionnelle: Modèles Fiables Et Conformes Aux Normes Du Secteur
Pré-Construits Pour Une Utilisation Rapide Et Efficace
Compatible MAC/PC, entièrement débloqué
Aucune Expertise N'Est Requise; Facile À Suivre
RADCOM Ltd. (RDCM) Bundle
Vous cherchez à évaluer la valeur intrinsèque de Radcom Ltd.? Notre calculatrice RDCM DCF intègre des données réelles avec des fonctionnalités de personnalisation approfondies, vous permettant d'affiner vos projections et d'améliorer vos choix d'investissement.
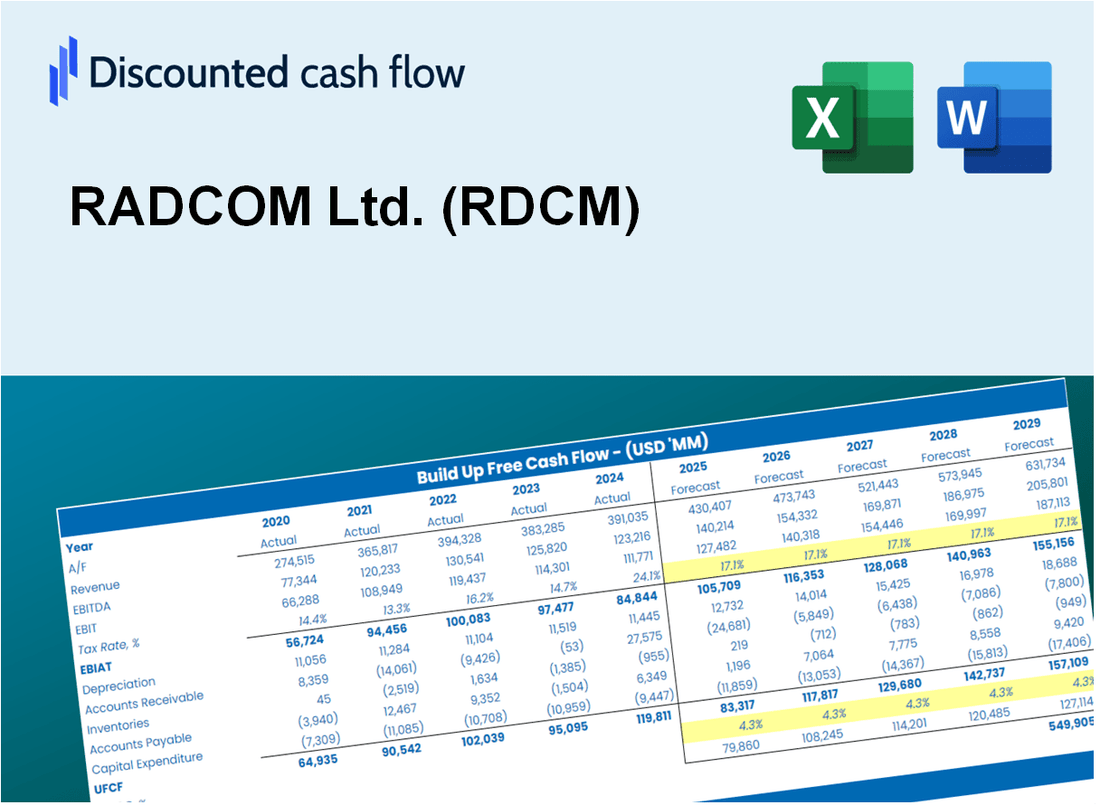
Discounted Cash Flow (DCF) - (USD MM)
| Year | AY1 2020 |
AY2 2021 |
AY3 2022 |
AY4 2023 |
AY5 2024 |
FY1 2025 |
FY2 2026 |
FY3 2027 |
FY4 2028 |
FY5 2029 |
|---|---|---|---|---|---|---|---|---|---|---|
| Revenue | 37.6 | 40.3 | 46.1 | 51.6 | 61.0 | 68.9 | 77.8 | 87.9 | 99.3 | 112.2 |
| Revenue Growth, % | 0 | 7.24 | 14.32 | 12.05 | 18.23 | 12.96 | 12.96 | 12.96 | 12.96 | 12.96 |
| EBITDA | -3.9 | -5.0 | -3.6 | .0 | 3.8 | -3.4 | -3.8 | -4.3 | -4.8 | -5.5 |
| EBITDA, % | -10.34 | -12.3 | -7.9 | 0.03100775 | 6.17 | -4.87 | -4.87 | -4.87 | -4.87 | -4.87 |
| Depreciation | .7 | .5 | .5 | .6 | .7 | .9 | 1.0 | 1.2 | 1.3 | 1.5 |
| Depreciation, % | 1.86 | 1.34 | 1.04 | 1.2 | 1.11 | 1.31 | 1.31 | 1.31 | 1.31 | 1.31 |
| EBIT | -4.6 | -5.5 | -4.1 | -.6 | 3.1 | -4.3 | -4.8 | -5.4 | -6.1 | -6.9 |
| EBIT, % | -12.2 | -13.64 | -8.93 | -1.17 | 5.06 | -6.18 | -6.18 | -6.18 | -6.18 | -6.18 |
| Total Cash | 69.0 | 70.6 | 73.7 | 82.2 | 94.7 | 68.9 | 77.8 | 87.9 | 99.3 | 112.2 |
| Total Cash, percent | .0 | .0 | .0 | .0 | .0 | .0 | .0 | .0 | .0 | .0 |
| Account Receivables | 12.7 | 10.4 | 11.6 | 14.1 | 19.7 | 19.9 | 22.5 | 25.4 | 28.7 | 32.4 |
| Account Receivables, % | 33.94 | 25.82 | 25.1 | 27.36 | 32.23 | 28.89 | 28.89 | 28.89 | 28.89 | 28.89 |
| Inventories | .5 | .9 | .8 | .2 | 1.7 | 1.2 | 1.4 | 1.5 | 1.7 | 1.9 |
| Inventories, % | 1.44 | 2.31 | 1.73 | 0.47674 | 2.73 | 1.74 | 1.74 | 1.74 | 1.74 | 1.74 |
| Accounts Payable | 1.6 | 2.7 | 2.7 | 2.6 | 2.5 | 3.6 | 4.0 | 4.5 | 5.1 | 5.8 |
| Accounts Payable, % | 4.24 | 6.58 | 5.88 | 5.12 | 4.03 | 5.17 | 5.17 | 5.17 | 5.17 | 5.17 |
| Capital Expenditure | -.4 | -.4 | -.2 | -.2 | -.4 | -.5 | -.6 | -.7 | -.7 | -.8 |
| Capital Expenditure, % | -1.14 | -1.08 | -0.32573 | -0.44961 | -0.6999 | -0.73937 | -0.73937 | -0.73937 | -0.73937 | -0.73937 |
| Tax Rate, % | 3.25 | 3.25 | 3.25 | 3.25 | 3.25 | 3.25 | 3.25 | 3.25 | 3.25 | 3.25 |
| EBITAT | -4.8 | -5.6 | -4.4 | -.6 | 3.0 | -4.2 | -4.7 | -5.3 | -6.0 | -6.8 |
| Depreciation | ||||||||||
| Changes in Account Receivables | ||||||||||
| Changes in Inventories | ||||||||||
| Changes in Accounts Payable | ||||||||||
| Capital Expenditure | ||||||||||
| UFCF | -16.3 | -2.5 | -5.1 | -2.3 | -3.9 | -2.5 | -6.6 | -7.4 | -8.4 | -9.5 |
| WACC, % | 6.55 | 6.55 | 6.55 | 6.55 | 6.55 | 6.55 | 6.55 | 6.55 | 6.55 | 6.55 |
| PV UFCF | ||||||||||
| SUM PV UFCF | -27.6 | |||||||||
| Long Term Growth Rate, % | 2.00 | |||||||||
| Free cash flow (T + 1) | -10 | |||||||||
| Terminal Value | -212 | |||||||||
| Present Terminal Value | -154 | |||||||||
| Enterprise Value | -182 | |||||||||
| Net Debt | -16 | |||||||||
| Equity Value | -166 | |||||||||
| Diluted Shares Outstanding, MM | 16 | |||||||||
| Equity Value Per Share | -10.29 |
What You Will Get
- Editable Forecast Inputs: Easily modify assumptions (growth %, margins, WACC) to explore various scenarios.
- Real-World Data: RADCOM Ltd.’s financial data pre-filled to kickstart your analysis.
- Automatic DCF Outputs: The template computes Net Present Value (NPV) and intrinsic value for you.
- Customizable and Professional: A sleek Excel model that adjusts to your valuation requirements.
- Built for Analysts and Investors: Perfect for evaluating projections, validating strategies, and enhancing efficiency.
Key Features
- Customizable Financial Inputs: Adjust essential parameters such as revenue projections, operating margins, and R&D expenditures.
- Instant DCF Valuation: Quickly computes intrinsic value, net present value (NPV), and other financial metrics.
- High-Precision Analytics: Leverages RADCOM Ltd.'s (RDCM) actual financial data for accurate valuation results.
- Effortless Scenario Testing: Easily explore various assumptions and analyze different outcomes.
- Efficiency Booster: Streamlines the valuation process, eliminating the need for intricate model construction.
How It Works
- Step 1: Download the prebuilt Excel template featuring RADCOM Ltd.'s (RDCM) financial data.
- Step 2: Review the pre-filled sheets to familiarize yourself with the essential metrics.
- Step 3: Modify forecasts and assumptions in the editable yellow cells (WACC, growth, margins).
- Step 4: Instantly see the recalculated results, including RADCOM Ltd.'s (RDCM) intrinsic value.
- Step 5: Use the outputs to make informed investment choices or create detailed reports.
Why Choose RADCOM Ltd. (RDCM) Calculator?
- Accurate Data: Utilize real RADCOM financials for trustworthy valuation outcomes.
- Customizable: Tailor essential variables such as growth rates, WACC, and tax rates to align with your forecasts.
- Time-Saving: Pre-configured calculations save you the hassle of starting from the ground up.
- Professional-Grade Tool: Crafted for investors, analysts, and consultants in the field.
- User-Friendly: An intuitive design and clear instructions make it accessible for all users.
Who Should Use RADCOM Ltd. (RDCM)?
- Telecommunications Providers: Enhance network performance with advanced monitoring solutions.
- Network Engineers: Streamline operations using RADCOM's intuitive analytics platform.
- Consultants: Tailor the technology for client-specific network assessments and reports.
- Tech Enthusiasts: Explore the latest in network visibility and performance management.
- Academics and Students: Utilize RADCOM's tools as a resource for studies in telecommunications and networking.
What the Template Contains
- Comprehensive DCF Model: Editable template with detailed valuation calculations tailored for RADCOM Ltd. (RDCM).
- Real-World Data: RADCOM’s historical and projected financials preloaded for in-depth analysis.
- Customizable Parameters: Adjust WACC, growth rates, and tax assumptions to explore various scenarios.
- Financial Statements: Complete annual and quarterly breakdowns for enhanced insights.
- Key Ratios: Integrated analysis for profitability, efficiency, and leverage metrics.
- Dashboard with Visual Outputs: Charts and tables designed for clear, actionable results specific to RADCOM Ltd. (RDCM).
Disclaimer
All information, articles, and product details provided on this website are for general informational and educational purposes only. We do not claim any ownership over, nor do we intend to infringe upon, any trademarks, copyrights, logos, brand names, or other intellectual property mentioned or depicted on this site. Such intellectual property remains the property of its respective owners, and any references here are made solely for identification or informational purposes, without implying any affiliation, endorsement, or partnership.
We make no representations or warranties, express or implied, regarding the accuracy, completeness, or suitability of any content or products presented. Nothing on this website should be construed as legal, tax, investment, financial, medical, or other professional advice. In addition, no part of this site—including articles or product references—constitutes a solicitation, recommendation, endorsement, advertisement, or offer to buy or sell any securities, franchises, or other financial instruments, particularly in jurisdictions where such activity would be unlawful.
All content is of a general nature and may not address the specific circumstances of any individual or entity. It is not a substitute for professional advice or services. Any actions you take based on the information provided here are strictly at your own risk. You accept full responsibility for any decisions or outcomes arising from your use of this website and agree to release us from any liability in connection with your use of, or reliance upon, the content or products found herein.