
|
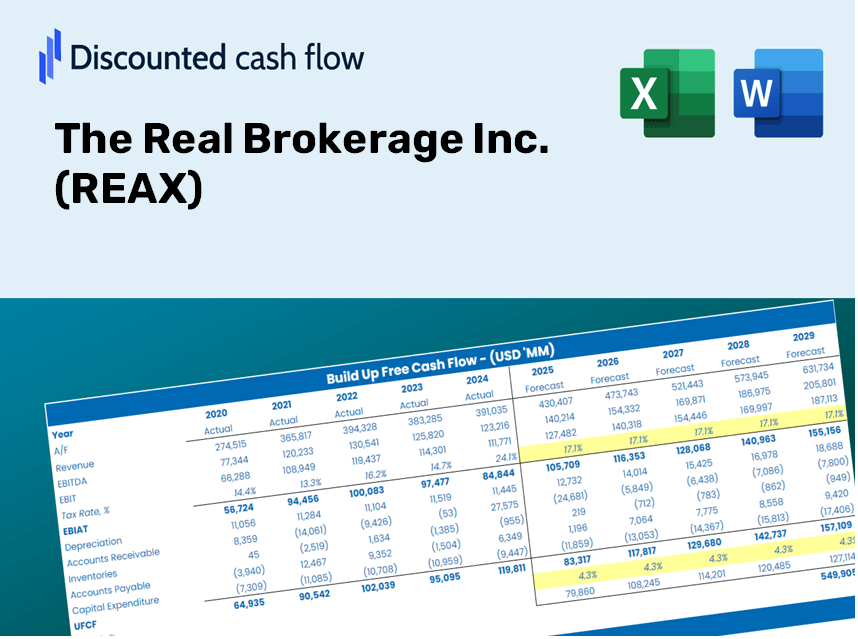
The Real Brokerage Inc. (REAX) Évaluation DCF |
Entièrement Modifiable: Adapté À Vos Besoins Dans Excel Ou Sheets
Conception Professionnelle: Modèles Fiables Et Conformes Aux Normes Du Secteur
Pré-Construits Pour Une Utilisation Rapide Et Efficace
Compatible MAC/PC, entièrement débloqué
Aucune Expertise N'Est Requise; Facile À Suivre
The Real Brokerage Inc. (REAX) Bundle
Conçu pour la précision, notre (Reax) Calculator DCF vous permet d'évaluer l'évaluation réelle de courtage Inc. à l'aide de données financières réelles et offre une flexibilité complète pour modifier tous les paramètres essentiels pour l'amélioration des projections.
What You Will Receive
- Authentic REAX Financial Data: Pre-loaded with The Real Brokerage Inc.'s historical and forecasted figures for accurate analysis.
- Completely Customizable Template: Easily adjust essential inputs such as revenue growth, WACC, and EBITDA %.
- Instant Calculations: Watch the intrinsic value of REAX update in real time as you make adjustments.
- Expert Valuation Tool: Tailored for investors, analysts, and consultants who require precise DCF outcomes.
- Intuitive Design: Organized layout and straightforward instructions suitable for all skill levels.
Key Features
- Authentic REAX Financial Data: Gain access to reliable pre-loaded historical figures and future forecasts.
- Tailored Forecast Assumptions: Modify highlighted fields such as WACC, growth rates, and margins according to your analysis.
- Real-Time Calculations: Enjoy automatic updates for DCF, Net Present Value (NPV), and cash flow evaluations.
- Interactive Visual Dashboard: Utilize easy-to-interpret charts and summaries to represent your valuation findings.
- Suitable for All Experience Levels: Designed with an intuitive layout for investors, CFOs, and consultants alike.
How It Works
- Step 1: Download the Excel file for The Real Brokerage Inc. (REAX).
- Step 2: Examine the pre-populated financial data and projections for The Real Brokerage Inc.
- Step 3: Adjust key parameters such as revenue growth, WACC, and tax rates (highlighted cells).
- Step 4: Observe the DCF model refresh in real-time as you modify your assumptions.
- Step 5: Evaluate the results and utilize them for your investment strategies.
Why Choose The Real Brokerage Inc. (REAX) Calculator?
- Precision: Utilizes authentic financial data for reliable results.
- Adaptability: Built for users to freely test and adjust their inputs.
- Efficiency: Eliminate the need to construct a complex financial model from the ground up.
- Expert-Level: Crafted with the accuracy and usability expected by industry leaders.
- Intuitive: Simple to navigate, even for those new to financial modeling.
Who Can Benefit from The Real Brokerage Inc. (REAX)?
- Individual Investors: Gain insights to make informed decisions regarding investments in The Real Brokerage Inc. (REAX).
- Financial Analysts: Enhance valuation processes with accessible financial models tailored for The Real Brokerage Inc. (REAX).
- Consultants: Provide clients with accurate and timely valuation insights on The Real Brokerage Inc. (REAX).
- Real Estate Professionals: Understand valuation methodologies used for companies like The Real Brokerage Inc. (REAX) to refine your own strategies.
- Finance Students: Explore valuation techniques utilizing real-world examples and data from The Real Brokerage Inc. (REAX).
Contents of the Template
- Pre-Filled Data: Contains The Real Brokerage Inc.'s historical financials and projections.
- Discounted Cash Flow Model: Editable DCF valuation model featuring automated calculations.
- Weighted Average Cost of Capital (WACC): A specific sheet designed for WACC calculations based on user-defined inputs.
- Key Financial Ratios: Evaluate The Real Brokerage Inc.'s profitability, efficiency, and leverage metrics.
- Customizable Inputs: Easily modify revenue growth, margins, and tax rates.
- Clear Dashboard: Visual representations and tables that summarize essential valuation outcomes.
Disclaimer
All information, articles, and product details provided on this website are for general informational and educational purposes only. We do not claim any ownership over, nor do we intend to infringe upon, any trademarks, copyrights, logos, brand names, or other intellectual property mentioned or depicted on this site. Such intellectual property remains the property of its respective owners, and any references here are made solely for identification or informational purposes, without implying any affiliation, endorsement, or partnership.
We make no representations or warranties, express or implied, regarding the accuracy, completeness, or suitability of any content or products presented. Nothing on this website should be construed as legal, tax, investment, financial, medical, or other professional advice. In addition, no part of this site—including articles or product references—constitutes a solicitation, recommendation, endorsement, advertisement, or offer to buy or sell any securities, franchises, or other financial instruments, particularly in jurisdictions where such activity would be unlawful.
All content is of a general nature and may not address the specific circumstances of any individual or entity. It is not a substitute for professional advice or services. Any actions you take based on the information provided here are strictly at your own risk. You accept full responsibility for any decisions or outcomes arising from your use of this website and agree to release us from any liability in connection with your use of, or reliance upon, the content or products found herein.