
|
Ren - Redes Energéticas Nacionais, SGPS, S.A. (RENE.LS) Évaluation DCF |
Entièrement Modifiable: Adapté À Vos Besoins Dans Excel Ou Sheets
Conception Professionnelle: Modèles Fiables Et Conformes Aux Normes Du Secteur
Pré-Construits Pour Une Utilisation Rapide Et Efficace
Compatible MAC/PC, entièrement débloqué
Aucune Expertise N'Est Requise; Facile À Suivre
REN - Redes Energéticas Nacionais, SGPS, S.A. (RENE.LS) Bundle
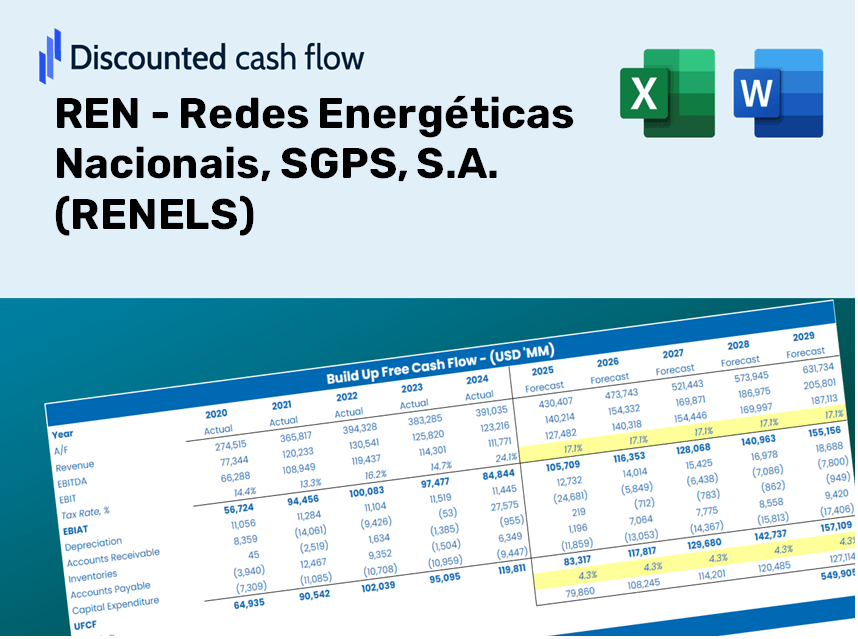
Que vous soyez un investisseur ou un analyste, cette (Ren) Calculator DCF est votre outil essentiel pour une évaluation précise. Préchargé avec des données réelles de Ren - Redes Energéticas Nacionais, SGPS, S.A. (Reels), vous pouvez ajuster les prévisions et observer les effets en temps réel.
Discounted Cash Flow (DCF) - (USD MM)
| Year | AY1 2020 |
AY2 2021 |
AY3 2022 |
AY4 2023 |
AY5 2024 |
FY1 2025 |
FY2 2026 |
FY3 2027 |
FY4 2028 |
FY5 2029 |
|---|---|---|---|---|---|---|---|---|---|---|
| Revenue | 705.3 | 781.1 | 763.3 | 947.9 | 982.9 | 935.4 | 890.2 | 847.2 | 806.2 | 767.3 |
| Revenue Growth, % | 0 | 10.74 | -2.27 | 24.18 | 3.69 | -4.83 | -4.83 | -4.83 | -4.83 | -4.83 |
| EBITDA | 443.4 | 437.0 | 460.3 | 539.4 | 452.7 | 527.7 | 502.2 | 477.9 | 454.8 | 432.9 |
| EBITDA, % | 62.87 | 55.94 | 60.31 | 56.91 | 46.06 | 56.42 | 56.42 | 56.42 | 56.42 | 56.42 |
| Depreciation | 241.2 | 241.9 | 249.3 | 253.2 | 254.7 | 281.5 | 267.8 | 254.9 | 242.6 | 230.9 |
| Depreciation, % | 34.19 | 30.97 | 32.66 | 26.71 | 25.91 | 30.09 | 30.09 | 30.09 | 30.09 | 30.09 |
| EBIT | 202.3 | 195.0 | 211.1 | 286.2 | 198.0 | 246.3 | 234.4 | 223.0 | 212.3 | 202.0 |
| EBIT, % | 28.68 | 24.97 | 27.65 | 30.19 | 20.15 | 26.33 | 26.33 | 26.33 | 26.33 | 26.33 |
| Total Cash | 61.5 | 398.8 | 1,365.3 | 40.1 | 40.5 | 314.5 | 299.3 | 284.9 | 271.1 | 258.0 |
| Total Cash, percent | .0 | .0 | .0 | .0 | .0 | .0 | .0 | .0 | .0 | .0 |
| Account Receivables | 239.8 | 374.5 | 338.4 | 357.6 | 485.0 | 399.1 | 379.8 | 361.5 | 344.0 | 327.4 |
| Account Receivables, % | 33.99 | 47.95 | 44.34 | 37.73 | 49.35 | 42.67 | 42.67 | 42.67 | 42.67 | 42.67 |
| Inventories | 2.5 | 8.5 | 5.1 | 7.2 | 2.5 | 5.9 | 5.6 | 5.3 | 5.0 | 4.8 |
| Inventories, % | 0.34735 | 1.09 | 0.67259 | 0.75885 | 0.25822 | 0.6262 | 0.6262 | 0.6262 | 0.6262 | 0.6262 |
| Accounts Payable | 164.6 | 252.0 | 219.1 | 352.1 | 193.5 | 264.1 | 251.3 | 239.1 | 227.6 | 216.6 |
| Accounts Payable, % | 23.34 | 32.27 | 28.71 | 37.14 | 19.69 | 28.23 | 28.23 | 28.23 | 28.23 | 28.23 |
| Capital Expenditure | -170.6 | -201.6 | -207.8 | -249.7 | -11.3 | -195.9 | -186.4 | -177.4 | -168.9 | -160.7 |
| Capital Expenditure, % | -24.19 | -25.81 | -27.23 | -26.34 | -1.15 | -20.94 | -20.94 | -20.94 | -20.94 | -20.94 |
| Tax Rate, % | 8.96 | 8.96 | 8.96 | 8.96 | 8.96 | 8.96 | 8.96 | 8.96 | 8.96 | 8.96 |
| EBITAT | 121.3 | 107.5 | 121.6 | 193.9 | 180.3 | 163.3 | 155.4 | 147.9 | 140.7 | 133.9 |
| Depreciation | ||||||||||
| Changes in Account Receivables | ||||||||||
| Changes in Inventories | ||||||||||
| Changes in Accounts Payable | ||||||||||
| Capital Expenditure | ||||||||||
| UFCF | 114.2 | 94.4 | 169.6 | 309.1 | 142.3 | 401.9 | 243.6 | 231.8 | 220.6 | 210.0 |
| WACC, % | 3.24 | 3.14 | 3.19 | 3.39 | 3.86 | 3.37 | 3.37 | 3.37 | 3.37 | 3.37 |
| PV UFCF | ||||||||||
| SUM PV UFCF | 1,197.9 | |||||||||
| Long Term Growth Rate, % | 2.00 | |||||||||
| Free cash flow (T + 1) | 214 | |||||||||
| Terminal Value | 15,686 | |||||||||
| Present Terminal Value | 13,293 | |||||||||
| Enterprise Value | 14,491 | |||||||||
| Net Debt | 2,491 | |||||||||
| Equity Value | 12,000 | |||||||||
| Diluted Shares Outstanding, MM | 663 | |||||||||
| Equity Value Per Share | 18.09 |
Benefits You Will Enjoy
- Pre-Loaded Financial Model: REN’s actual data allows for accurate DCF valuation.
- Comprehensive Forecast Control: Modify revenue growth, margins, WACC, and other essential drivers.
- Real-Time Calculations: Automatic updates let you see results immediately as you make adjustments.
- Professional-Grade Template: An optimized Excel file crafted for high-quality valuation.
- Flexible and Reusable: Designed for adaptability, enabling repeated use for in-depth forecasts.
Key Features
- Customizable Forecast Inputs: Adjust essential parameters such as revenue growth, EBITDA %, and capital expenditures tailored to REN - Redes Energéticas Nacionais, SGPS, S.A. ([RENELS]).
- Instant DCF Valuation: Quickly computes intrinsic value, NPV, and additional metrics for informed decision-making.
- Precision You Can Trust: Leverages REN ([RENELS])'s actual financial data for dependable valuation results.
- Simplified Scenario Analysis: Effortlessly experiment with varying assumptions and visualize different outcomes.
- Efficiency Booster: Avoid the hassle of constructing intricate valuation models from the ground up.
How It Functions
- Obtain the Template: Gain immediate access to the Excel-based RENELS DCF Calculator.
- Enter Your Assumptions: Modify the yellow-highlighted cells for growth rates, WACC, margins, and other variables.
- Automatic Calculations: The model promptly recalculates RENELS' intrinsic value.
- Explore Scenarios: Experiment with various assumptions to assess potential changes in valuation.
- Evaluate and Decide: Leverage the findings to inform your investment or financial analysis.
Why Choose This Calculator for RENELS ([REN])?
- Designed for Experts: A specialized tool utilized by energy analysts, CFOs, and consultants.
- Accurate Data: RENELS' historical and projected financials are preloaded for precision.
- Dynamic Scenario Analysis: Effortlessly test various forecasts and assumptions.
- Transparent Results: Automatically computes intrinsic value, NPV, and essential metrics.
- User-Friendly: Comprehensive step-by-step guidance simplifies the process.
Who Is This Product Designed For?
- Investors: Evaluate REN - Redes Energéticas Nacionais, SGPS, S.A.'s (RENELS) valuation before making stock transactions.
- CFOs and Financial Analysts: Enhance valuation processes and validate financial forecasts.
- Startup Founders: Gain insights into how large public entities like REN - Redes Energéticas Nacionais, SGPS, S.A. (RENELS) determine their market value.
- Consultants: Provide expert valuation reports for your clients based on REN - Redes Energéticas Nacionais, SGPS, A. (RENELS).
- Students and Educators: Utilize real-world data from REN - Redes Energéticas Nacionais, SGPS, A. (RENELS) to learn and teach valuation methodologies.
Contents of the Template
- Pre-Filled Data: Contains REN - Redes Energéticas Nacionais, SGPS, S.A. (RENELS) historical financials and projections.
- Discounted Cash Flow Model: An editable DCF valuation model featuring automatic calculation capabilities.
- Weighted Average Cost of Capital (WACC): A specific sheet designed for calculating WACC using customized inputs.
- Key Financial Ratios: Evaluate REN - Redes Energéticas Nacionais, SGPS, S.A. (RENELS) profitability, efficiency, and leverage metrics.
- Customizable Inputs: Easily adjust revenue growth rates, profit margins, and tax rates.
- Clear Dashboard: Visual representations and tables that summarize key valuation outcomes.
Disclaimer
All information, articles, and product details provided on this website are for general informational and educational purposes only. We do not claim any ownership over, nor do we intend to infringe upon, any trademarks, copyrights, logos, brand names, or other intellectual property mentioned or depicted on this site. Such intellectual property remains the property of its respective owners, and any references here are made solely for identification or informational purposes, without implying any affiliation, endorsement, or partnership.
We make no representations or warranties, express or implied, regarding the accuracy, completeness, or suitability of any content or products presented. Nothing on this website should be construed as legal, tax, investment, financial, medical, or other professional advice. In addition, no part of this site—including articles or product references—constitutes a solicitation, recommendation, endorsement, advertisement, or offer to buy or sell any securities, franchises, or other financial instruments, particularly in jurisdictions where such activity would be unlawful.
All content is of a general nature and may not address the specific circumstances of any individual or entity. It is not a substitute for professional advice or services. Any actions you take based on the information provided here are strictly at your own risk. You accept full responsibility for any decisions or outcomes arising from your use of this website and agree to release us from any liability in connection with your use of, or reliance upon, the content or products found herein.