
|
Gibraltar Industries, Inc. (ROCK) Évaluation DCF |
Entièrement Modifiable: Adapté À Vos Besoins Dans Excel Ou Sheets
Conception Professionnelle: Modèles Fiables Et Conformes Aux Normes Du Secteur
Pré-Construits Pour Une Utilisation Rapide Et Efficace
Compatible MAC/PC, entièrement débloqué
Aucune Expertise N'Est Requise; Facile À Suivre
Gibraltar Industries, Inc. (ROCK) Bundle
Conçu pour la précision, notre calculatrice DCF (ROCK) vous permet d'évaluer l'évaluation de Gibraltar Industries, Inc. en utilisant des données financières réelles tout en offrant une flexibilité complète pour modifier tous les paramètres essentiels pour des projections améliorées.
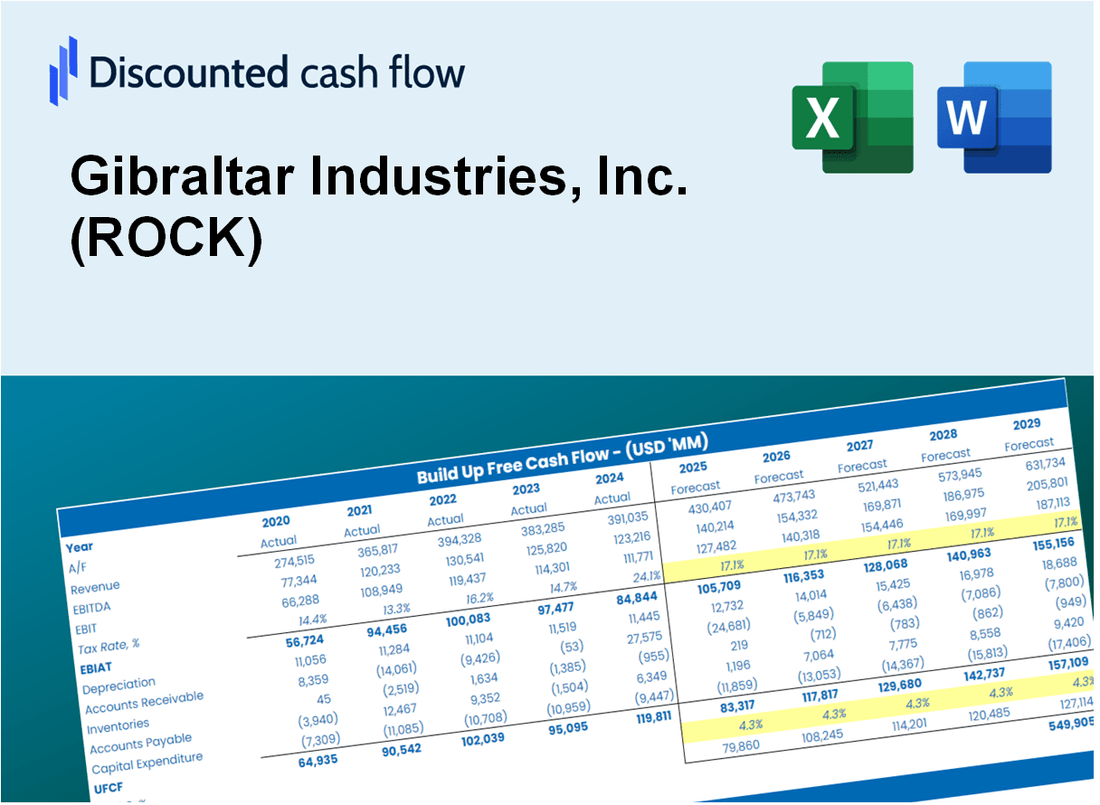
Discounted Cash Flow (DCF) - (USD MM)
| Year | AY1 2020 |
AY2 2021 |
AY3 2022 |
AY4 2023 |
AY5 2024 |
FY1 2025 |
FY2 2026 |
FY3 2027 |
FY4 2028 |
FY5 2029 |
|---|---|---|---|---|---|---|---|---|---|---|
| Revenue | 1,032.6 | 1,339.8 | 1,390.0 | 1,377.7 | 1,308.8 | 1,399.1 | 1,495.7 | 1,598.9 | 1,709.3 | 1,827.3 |
| Revenue Growth, % | 0 | 29.75 | 3.75 | -0.87988 | -5.01 | 6.9 | 6.9 | 6.9 | 6.9 | 6.9 |
| EBITDA | 129.4 | 146.1 | 141.7 | 179.4 | 181.6 | 169.4 | 181.1 | 193.6 | 206.9 | 221.2 |
| EBITDA, % | 12.53 | 10.91 | 10.19 | 13.02 | 13.88 | 12.11 | 12.11 | 12.11 | 12.11 | 12.11 |
| Depreciation | 20.9 | 32.0 | 26.2 | 27.4 | 27.3 | 29.0 | 31.0 | 33.2 | 35.4 | 37.9 |
| Depreciation, % | 2.03 | 2.39 | 1.88 | 1.99 | 2.09 | 2.07 | 2.07 | 2.07 | 2.07 | 2.07 |
| EBIT | 108.5 | 114.2 | 115.5 | 152.0 | 154.3 | 140.4 | 150.1 | 160.4 | 171.5 | 183.3 |
| EBIT, % | 10.5 | 8.52 | 8.31 | 11.03 | 11.79 | 10.03 | 10.03 | 10.03 | 10.03 | 10.03 |
| Total Cash | 32.1 | 12.8 | 17.6 | 99.4 | 269.5 | 92.7 | 99.1 | 106.0 | 113.3 | 121.1 |
| Total Cash, percent | .0 | .0 | .0 | .0 | .0 | .0 | .0 | .0 | .0 | .0 |
| Account Receivables | 198.0 | 236.4 | 217.2 | 224.6 | 203.9 | 236.0 | 252.2 | 269.7 | 288.3 | 308.2 |
| Account Receivables, % | 19.17 | 17.65 | 15.62 | 16.3 | 15.58 | 16.86 | 16.86 | 16.86 | 16.86 | 16.86 |
| Inventories | 98.3 | 176.2 | 170.4 | 120.5 | 138.1 | 151.7 | 162.2 | 173.4 | 185.4 | 198.2 |
| Inventories, % | 9.52 | 13.15 | 12.26 | 8.75 | 10.55 | 10.85 | 10.85 | 10.85 | 10.85 | 10.85 |
| Accounts Payable | 134.7 | 172.3 | 106.6 | 92.1 | 117.4 | 137.8 | 147.3 | 157.4 | 168.3 | 179.9 |
| Accounts Payable, % | 13.05 | 12.86 | 7.67 | 6.69 | 8.97 | 9.85 | 9.85 | 9.85 | 9.85 | 9.85 |
| Capital Expenditure | -13.1 | -17.7 | -20.1 | -13.9 | -19.9 | -18.4 | -19.6 | -21.0 | -22.4 | -24.0 |
| Capital Expenditure, % | -1.27 | -1.32 | -1.44 | -1.01 | -1.52 | -1.31 | -1.31 | -1.31 | -1.31 | -1.31 |
| Tax Rate, % | 21.03 | 21.03 | 21.03 | 21.03 | 21.03 | 21.03 | 21.03 | 21.03 | 21.03 | 21.03 |
| EBITAT | 65.0 | 86.7 | 85.4 | 112.8 | 121.9 | 101.9 | 108.9 | 116.4 | 124.5 | 133.1 |
| Depreciation | ||||||||||
| Changes in Account Receivables | ||||||||||
| Changes in Inventories | ||||||||||
| Changes in Accounts Payable | ||||||||||
| Capital Expenditure | ||||||||||
| UFCF | -88.7 | 22.2 | 50.9 | 154.2 | 157.5 | 87.2 | 103.1 | 110.2 | 117.8 | 125.9 |
| WACC, % | 9.52 | 9.53 | 9.53 | 9.53 | 9.53 | 9.53 | 9.53 | 9.53 | 9.53 | 9.53 |
| PV UFCF | ||||||||||
| SUM PV UFCF | 411.1 | |||||||||
| Long Term Growth Rate, % | 3.00 | |||||||||
| Free cash flow (T + 1) | 130 | |||||||||
| Terminal Value | 1,987 | |||||||||
| Present Terminal Value | 1,260 | |||||||||
| Enterprise Value | 1,672 | |||||||||
| Net Debt | -223 | |||||||||
| Equity Value | 1,894 | |||||||||
| Diluted Shares Outstanding, MM | 31 | |||||||||
| Equity Value Per Share | 61.57 |
What You Will Get
- Real ROCK Financials: Access to historical and projected data for precise valuation.
- Customizable Inputs: Adjust WACC, tax rates, revenue growth, and capital expenditures as needed.
- Dynamic Calculations: Intrinsic value and NPV are computed in real-time.
- Scenario Analysis: Evaluate various scenarios to assess Gibraltar’s future performance.
- User-Friendly Design: Designed for professionals while remaining approachable for newcomers.
Key Features
- 🔍 Real-Life ROCK Financials: Pre-filled historical and projected data for Gibraltar Industries, Inc.
- ✏️ Fully Customizable Inputs: Adjust all critical parameters (yellow cells) like WACC, growth %, and tax rates.
- 📊 Professional DCF Valuation: Built-in formulas calculate Gibraltar’s intrinsic value using the Discounted Cash Flow method.
- ⚡ Instant Results: Visualize Gibraltar’s valuation instantly after making changes.
- Scenario Analysis: Test and compare outcomes for various financial assumptions side-by-side.
How It Works
- Download the Template: Gain immediate access to the Excel-based Gibraltar Industries, Inc. (ROCK) DCF Calculator.
- Input Your Assumptions: Modify the yellow-highlighted cells for growth rates, WACC, margins, and other key metrics.
- Instant Calculations: The model will automatically refresh to reflect Gibraltar's intrinsic value.
- Test Scenarios: Experiment with various assumptions to assess potential changes in valuation.
- Analyze and Decide: Utilize the outcomes to inform your investment or financial strategy.
Why Choose This Calculator for Gibraltar Industries, Inc. (ROCK)?
- Precision: Utilizes real Gibraltar Industries financial data for enhanced accuracy.
- Versatility: Built for users to easily test and adjust inputs as needed.
- Efficiency: Avoid the complexities of creating a DCF model from the ground up.
- Expert Quality: Crafted with the precision and usability expected at the CFO level.
- Intuitive Design: Simple to navigate, even for those lacking advanced financial modeling skills.
Who Should Use This Product?
- Investors: Assess Gibraltar Industries, Inc. (ROCK)'s valuation prior to making investment decisions.
- CFOs and Financial Analysts: Enhance valuation methodologies and evaluate financial projections for Gibraltar Industries, Inc. (ROCK).
- Startup Founders: Discover the valuation strategies used by established companies like Gibraltar Industries, Inc. (ROCK).
- Consultants: Create comprehensive valuation reports for clients involving Gibraltar Industries, Inc. (ROCK).
- Students and Educators: Utilize real-time data to learn and instruct on valuation practices related to Gibraltar Industries, Inc. (ROCK).
What the Template Contains
- Historical Data: Includes Gibraltar Industries’ past financials and baseline forecasts.
- DCF and Levered DCF Models: Detailed templates to calculate Gibraltar Industries’ intrinsic value.
- WACC Sheet: Pre-built calculations for Weighted Average Cost of Capital.
- Editable Inputs: Modify key drivers like growth rates, EBITDA %, and CAPEX assumptions.
- Quarterly and Annual Statements: A complete breakdown of Gibraltar Industries’ financials.
- Interactive Dashboard: Visualize valuation results and projections dynamically.
Disclaimer
All information, articles, and product details provided on this website are for general informational and educational purposes only. We do not claim any ownership over, nor do we intend to infringe upon, any trademarks, copyrights, logos, brand names, or other intellectual property mentioned or depicted on this site. Such intellectual property remains the property of its respective owners, and any references here are made solely for identification or informational purposes, without implying any affiliation, endorsement, or partnership.
We make no representations or warranties, express or implied, regarding the accuracy, completeness, or suitability of any content or products presented. Nothing on this website should be construed as legal, tax, investment, financial, medical, or other professional advice. In addition, no part of this site—including articles or product references—constitutes a solicitation, recommendation, endorsement, advertisement, or offer to buy or sell any securities, franchises, or other financial instruments, particularly in jurisdictions where such activity would be unlawful.
All content is of a general nature and may not address the specific circumstances of any individual or entity. It is not a substitute for professional advice or services. Any actions you take based on the information provided here are strictly at your own risk. You accept full responsibility for any decisions or outcomes arising from your use of this website and agree to release us from any liability in connection with your use of, or reliance upon, the content or products found herein.