
|
RPM International Inc. (RPM) Évaluation DCF |
Entièrement Modifiable: Adapté À Vos Besoins Dans Excel Ou Sheets
Conception Professionnelle: Modèles Fiables Et Conformes Aux Normes Du Secteur
Pré-Construits Pour Une Utilisation Rapide Et Efficace
Compatible MAC/PC, entièrement débloqué
Aucune Expertise N'Est Requise; Facile À Suivre
RPM International Inc. (RPM) Bundle
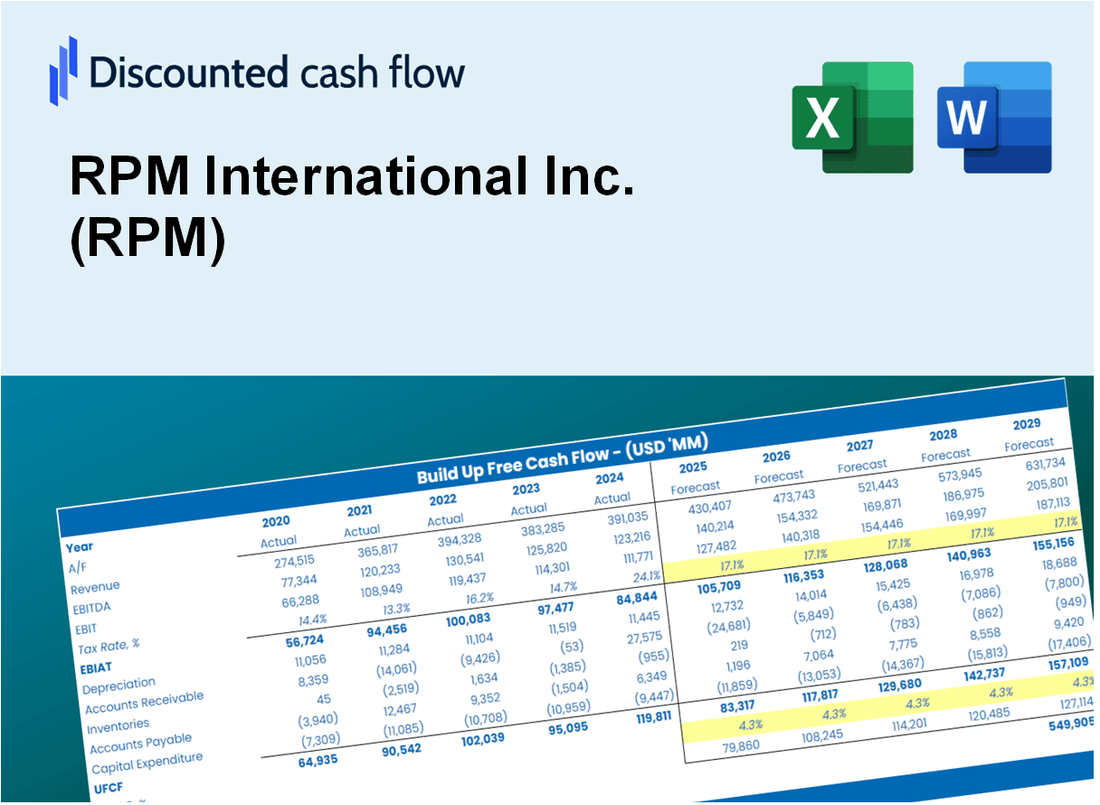
Gardez un aperçu de votre analyse d'évaluation RPM International Inc. (RPM) avec notre calculatrice DCF de pointe! Charge avec des données RPM réelles, ce modèle Excel vous permet d'ajuster les prévisions et les hypothèses pour déterminer avec précision la valeur intrinsèque de RPM International Inc.
Discounted Cash Flow (DCF) - (USD MM)
| Year | AY1 2021 |
AY2 2022 |
AY3 2023 |
AY4 2024 |
AY5 2025 |
FY1 2026 |
FY2 2027 |
FY3 2028 |
FY4 2029 |
FY5 2030 |
|---|---|---|---|---|---|---|---|---|---|---|
| Revenue | 6,106.3 | 6,707.7 | 7,256.4 | 7,335.3 | 7,372.6 | 7,734.4 | 8,113.9 | 8,512.0 | 8,929.6 | 9,367.7 |
| Revenue Growth, % | 0 | 9.85 | 8.18 | 1.09 | 0.50941 | 4.91 | 4.91 | 4.91 | 4.91 | 4.91 |
| EBITDA | 897.3 | 844.5 | 923.3 | 1,077.1 | 1,083.1 | 1,073.3 | 1,126.0 | 1,181.2 | 1,239.1 | 1,299.9 |
| EBITDA, % | 14.69 | 12.59 | 12.72 | 14.68 | 14.69 | 13.88 | 13.88 | 13.88 | 13.88 | 13.88 |
| Depreciation | 146.9 | 153.1 | 154.9 | 171.3 | 193.8 | 182.3 | 191.3 | 200.6 | 210.5 | 220.8 |
| Depreciation, % | 2.41 | 2.28 | 2.14 | 2.33 | 2.63 | 2.36 | 2.36 | 2.36 | 2.36 | 2.36 |
| EBIT | 750.5 | 691.5 | 768.4 | 905.8 | 889.3 | 891.0 | 934.7 | 980.5 | 1,028.7 | 1,079.1 |
| EBIT, % | 12.29 | 10.31 | 10.59 | 12.35 | 12.06 | 11.52 | 11.52 | 11.52 | 11.52 | 11.52 |
| Total Cash | 246.7 | 201.7 | 215.8 | 237.4 | 302.1 | 268.5 | 281.6 | 295.4 | 309.9 | 325.1 |
| Total Cash, percent | .0 | .0 | .0 | .0 | .0 | .0 | .0 | .0 | .0 | .0 |
| Account Receivables | 1,280.8 | 1,432.6 | 1,503.0 | 1,419.4 | 1,509.1 | 1,591.2 | 1,669.3 | 1,751.2 | 1,837.1 | 1,927.2 |
| Account Receivables, % | 20.98 | 21.36 | 20.71 | 19.35 | 20.47 | 20.57 | 20.57 | 20.57 | 20.57 | 20.57 |
| Inventories | 938.1 | 1,212.6 | 1,135.5 | 956.5 | 1,036.5 | 1,178.5 | 1,236.3 | 1,297.0 | 1,360.6 | 1,427.4 |
| Inventories, % | 15.36 | 18.08 | 15.65 | 13.04 | 14.06 | 15.24 | 15.24 | 15.24 | 15.24 | 15.24 |
| Accounts Payable | 717.2 | 800.4 | 680.9 | 649.7 | 755.9 | 807.0 | 846.6 | 888.1 | 931.7 | 977.4 |
| Accounts Payable, % | 11.74 | 11.93 | 9.38 | 8.86 | 10.25 | 10.43 | 10.43 | 10.43 | 10.43 | 10.43 |
| Capital Expenditure | -157.2 | -222.4 | -254.4 | -214.0 | -229.9 | -238.7 | -250.4 | -262.7 | -275.6 | -289.1 |
| Capital Expenditure, % | -2.57 | -3.32 | -3.51 | -2.92 | -3.12 | -3.09 | -3.09 | -3.09 | -3.09 | -3.09 |
| Tax Rate, % | 13.13 | 13.13 | 13.13 | 13.13 | 13.13 | 13.13 | 13.13 | 13.13 | 13.13 | 13.13 |
| EBITAT | 564.3 | 560.0 | 566.4 | 676.5 | 772.6 | 697.6 | 731.8 | 767.7 | 805.4 | 844.9 |
| Depreciation | ||||||||||
| Changes in Account Receivables | ||||||||||
| Changes in Inventories | ||||||||||
| Changes in Accounts Payable | ||||||||||
| Capital Expenditure | ||||||||||
| UFCF | -947.7 | 147.6 | 354.2 | 865.1 | 673.0 | 468.1 | 576.3 | 604.6 | 634.3 | 665.4 |
| WACC, % | 7.59 | 7.62 | 7.58 | 7.58 | 7.66 | 7.61 | 7.61 | 7.61 | 7.61 | 7.61 |
| PV UFCF | ||||||||||
| SUM PV UFCF | 2,352.4 | |||||||||
| Long Term Growth Rate, % | 3.00 | |||||||||
| Free cash flow (T + 1) | 685 | |||||||||
| Terminal Value | 14,881 | |||||||||
| Present Terminal Value | 10,315 | |||||||||
| Enterprise Value | 12,667 | |||||||||
| Net Debt | 2,662 | |||||||||
| Equity Value | 10,006 | |||||||||
| Diluted Shares Outstanding, MM | 128 | |||||||||
| Equity Value Per Share | 78.04 |
What You Will Receive
- Comprehensive Financial Model: RPM International Inc.’s actual data facilitates accurate DCF valuation.
- Complete Forecast Control: Modify revenue growth, profit margins, WACC, and other essential metrics.
- Real-Time Calculations: Automatic updates provide immediate feedback as you adjust inputs.
- Professional-Grade Template: A polished Excel file crafted for high-quality valuation analysis.
- Flexible and Reusable: Designed for adaptability, allowing for repeated application in detailed forecasting.
Key Features
- Comprehensive DCF Calculator: Features detailed unlevered and levered DCF valuation models tailored for RPM International Inc. (RPM).
- WACC Calculator: Pre-structured Weighted Average Cost of Capital sheet with adjustable inputs for precise calculations.
- Customizable Forecast Assumptions: Easily alter growth rates, capital expenditures, and discount rates to fit RPM's financial strategy.
- Integrated Financial Ratios: Evaluate profitability, leverage, and efficiency ratios specifically for RPM International Inc. (RPM).
- Interactive Dashboard and Charts: Visual representations highlight essential valuation metrics for straightforward analysis.
How It Works
- Step 1: Download the prebuilt Excel template featuring RPM International Inc. (RPM) data.
- Step 2: Review the pre-filled sheets to familiarize yourself with the essential metrics.
- Step 3: Modify forecasts and assumptions in the editable yellow cells (WACC, growth, margins).
- Step 4: Instantly see the recalculated results, including RPM International Inc.'s intrinsic value.
- Step 5: Make educated investment choices or create reports based on the outputs.
Why Choose This Calculator for RPM International Inc. (RPM)?
- Accurate Data: Up-to-date RPM financials provide trustworthy valuation outcomes.
- Customizable: Modify essential parameters such as growth rates, WACC, and tax rates to align with your forecasts.
- Time-Saving: Pre-configured calculations save you the hassle of starting from the ground up.
- Professional-Grade Tool: Tailored for investors, analysts, and consultants in the industry.
- User-Friendly: Simple design and clear instructions make it accessible for all users.
Who Should Use This Product?
- Finance Students: Explore valuation techniques and apply them with real-world data specific to RPM International Inc. (RPM).
- Academics: Integrate professional valuation models into your coursework or research focused on RPM International Inc. (RPM).
- Investors: Evaluate your assumptions and analyze valuation outcomes for RPM International Inc. (RPM) stock.
- Analysts: Enhance your analysis process with a customizable DCF model tailored for RPM International Inc. (RPM).
- Small Business Owners: Understand the valuation methods used for large public companies like RPM International Inc. (RPM).
What the Template Contains
- Preloaded RPM Data: Historical and projected financial data, including revenue, EBIT, and capital expenditures.
- DCF and WACC Models: Professional-grade sheets for calculating intrinsic value and Weighted Average Cost of Capital.
- Editable Inputs: Yellow-highlighted cells for adjusting revenue growth, tax rates, and discount rates.
- Financial Statements: Comprehensive annual and quarterly financials for deeper analysis.
- Key Ratios: Profitability, leverage, and efficiency ratios to evaluate performance.
- Dashboard and Charts: Visual summaries of valuation outcomes and assumptions.
Disclaimer
All information, articles, and product details provided on this website are for general informational and educational purposes only. We do not claim any ownership over, nor do we intend to infringe upon, any trademarks, copyrights, logos, brand names, or other intellectual property mentioned or depicted on this site. Such intellectual property remains the property of its respective owners, and any references here are made solely for identification or informational purposes, without implying any affiliation, endorsement, or partnership.
We make no representations or warranties, express or implied, regarding the accuracy, completeness, or suitability of any content or products presented. Nothing on this website should be construed as legal, tax, investment, financial, medical, or other professional advice. In addition, no part of this site—including articles or product references—constitutes a solicitation, recommendation, endorsement, advertisement, or offer to buy or sell any securities, franchises, or other financial instruments, particularly in jurisdictions where such activity would be unlawful.
All content is of a general nature and may not address the specific circumstances of any individual or entity. It is not a substitute for professional advice or services. Any actions you take based on the information provided here are strictly at your own risk. You accept full responsibility for any decisions or outcomes arising from your use of this website and agree to release us from any liability in connection with your use of, or reliance upon, the content or products found herein.