
|
RattanIndia Power Limited (Rtnpower.NS) Évaluation DCF |
Entièrement Modifiable: Adapté À Vos Besoins Dans Excel Ou Sheets
Conception Professionnelle: Modèles Fiables Et Conformes Aux Normes Du Secteur
Pré-Construits Pour Une Utilisation Rapide Et Efficace
Compatible MAC/PC, entièrement débloqué
Aucune Expertise N'Est Requise; Facile À Suivre
RattanIndia Power Limited (RTNPOWER.NS) Bundle
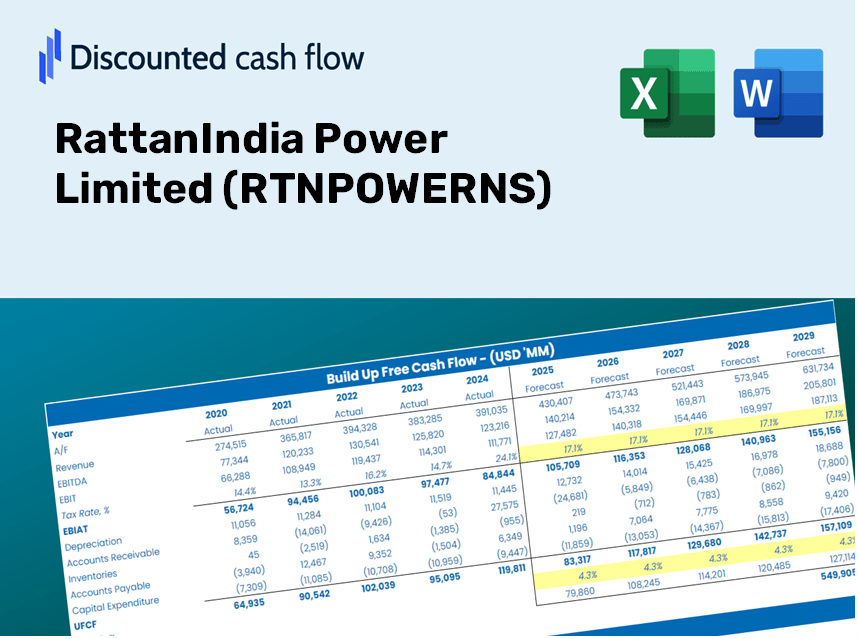
Conçu pour la précision, notre calculatrice DCF (RTNPowers) vous permet d'évaluer l'évaluation de RattanIndia Power Limited à l'aide de données financières du monde réel et offre une flexibilité complète pour modifier tous les paramètres essentiels pour des projections améliorées.
Discounted Cash Flow (DCF) - (USD MM)
| Year | AY1 2021 |
AY2 2022 |
AY3 2023 |
AY4 2024 |
AY5 2025 |
FY1 2026 |
FY2 2027 |
FY3 2028 |
FY4 2029 |
FY5 2030 |
|---|---|---|---|---|---|---|---|---|---|---|
| Revenue | 15,598.6 | 32,595.2 | 32,311.6 | 33,640.0 | 32,838.3 | 41,118.3 | 51,486.1 | 64,468.1 | 80,723.4 | 101,077.3 |
| Revenue Growth, % | 0 | 108.96 | -0.87002 | 4.11 | -2.38 | 25.21 | 25.21 | 25.21 | 25.21 | 25.21 |
| EBITDA | 17,143.8 | 7,748.4 | 10,665.0 | 116,217.2 | 5,846.5 | 22,580.7 | 28,274.3 | 35,403.6 | 44,330.4 | 55,508.1 |
| EBITDA, % | 109.91 | 23.77 | 33.01 | 345.47 | 17.8 | 54.92 | 54.92 | 54.92 | 54.92 | 54.92 |
| Depreciation | 4,155.2 | 4,144.5 | 4,043.7 | 3,819.4 | 2,407.3 | 5,802.0 | 7,265.0 | 9,096.8 | 11,390.5 | 14,262.5 |
| Depreciation, % | 26.64 | 12.72 | 12.51 | 11.35 | 7.33 | 14.11 | 14.11 | 14.11 | 14.11 | 14.11 |
| EBIT | 12,988.7 | 3,603.9 | 6,621.3 | 112,397.8 | 3,439.2 | 18,527.1 | 23,198.6 | 29,048.0 | 36,372.3 | 45,543.3 |
| EBIT, % | 83.27 | 11.06 | 20.49 | 334.12 | 10.47 | 45.06 | 45.06 | 45.06 | 45.06 | 45.06 |
| Total Cash | 716.9 | 2,739.3 | 2,415.3 | 4,616.6 | 3,625.3 | 3,720.3 | 4,658.3 | 5,832.9 | 7,303.6 | 9,145.2 |
| Total Cash, percent | .0 | .0 | .0 | .0 | .0 | .0 | .0 | .0 | .0 | .0 |
| Account Receivables | 22,541.0 | 25,112.2 | 24,944.8 | 20,673.5 | 24,350.9 | 32,060.2 | 40,144.0 | 50,266.1 | 62,940.4 | 78,810.5 |
| Account Receivables, % | 144.51 | 77.04 | 77.2 | 61.46 | 74.15 | 77.97 | 77.97 | 77.97 | 77.97 | 77.97 |
| Inventories | 2,774.0 | 1,366.4 | 1,360.4 | 2,380.9 | 2,633.7 | 3,395.0 | 4,251.1 | 5,323.0 | 6,665.1 | 8,345.7 |
| Inventories, % | 17.78 | 4.19 | 4.21 | 7.08 | 8.02 | 8.26 | 8.26 | 8.26 | 8.26 | 8.26 |
| Accounts Payable | 266.8 | 2,131.5 | 2,827.4 | 1,624.2 | 1,727.0 | 2,227.6 | 2,789.2 | 3,492.5 | 4,373.1 | 5,475.8 |
| Accounts Payable, % | 1.71 | 6.54 | 8.75 | 4.83 | 5.26 | 5.42 | 5.42 | 5.42 | 5.42 | 5.42 |
| Capital Expenditure | -37.1 | -148.1 | -307.6 | -985.5 | -1,167.0 | -668.4 | -836.9 | -1,048.0 | -1,312.2 | -1,643.1 |
| Capital Expenditure, % | -0.23807 | -0.45435 | -0.95198 | -2.93 | -3.55 | -1.63 | -1.63 | -1.63 | -1.63 | -1.63 |
| Tax Rate, % | 0 | 0 | 0 | 0 | 0 | 0 | 0 | 0 | 0 | 0 |
| EBITAT | 12,985.2 | 3,603.9 | 6,694.2 | 112,655.7 | 3,439.2 | 18,526.1 | 23,197.3 | 29,046.4 | 36,370.3 | 45,540.9 |
| Depreciation | ||||||||||
| Changes in Account Receivables | ||||||||||
| Changes in Inventories | ||||||||||
| Changes in Accounts Payable | ||||||||||
| Capital Expenditure | ||||||||||
| UFCF | -7,944.9 | 8,301.4 | 11,299.6 | 117,537.2 | 852.0 | 15,689.7 | 21,247.2 | 26,604.5 | 33,312.7 | 41,712.4 |
| WACC, % | 8.52 | 8.52 | 8.52 | 8.52 | 8.52 | 8.52 | 8.52 | 8.52 | 8.52 | 8.52 |
| PV UFCF | ||||||||||
| SUM PV UFCF | 105,039.1 | |||||||||
| Long Term Growth Rate, % | 3.00 | |||||||||
| Free cash flow (T + 1) | 42,964 | |||||||||
| Terminal Value | 777,755 | |||||||||
| Present Terminal Value | 516,669 | |||||||||
| Enterprise Value | 621,708 | |||||||||
| Net Debt | 32,524 | |||||||||
| Equity Value | 589,184 | |||||||||
| Diluted Shares Outstanding, MM | 5,413 | |||||||||
| Equity Value Per Share | 108.85 |
What You Will Receive
- Flexible Forecast Inputs: Effortlessly modify key assumptions (growth %, margins, WACC) to develop various scenarios.
- Real-World Data: Financial information for RattanIndia Power Limited (RTNPOWERNS) pre-filled to facilitate your analysis.
- Automatic DCF Outputs: The template automatically computes Net Present Value (NPV) and intrinsic value for you.
- Customizable and Professional: A refined Excel model tailored to meet your valuation requirements.
- Designed for Analysts and Investors: Perfect for evaluating projections, verifying strategies, and enhancing productivity.
Key Features
- Comprehensive RTNPOWERNS Data: Pre-filled with RattanIndia Power Limited's historical financials and future projections.
- Completely Customizable Inputs: Tailor revenue growth, margins, WACC, tax rates, and capital expenditures to your preferences.
- Dynamic Valuation Model: Automatically refreshes Net Present Value (NPV) and intrinsic value based on your adjustments.
- Scenario Analysis: Develop multiple forecasting scenarios to evaluate various valuation possibilities.
- User-Centric Design: Intuitive, organized, and suitable for both professionals and newcomers.
How It Works
- Step 1: Download the Excel file.
- Step 2: Review the pre-filled data for RattanIndia Power Limited (RTNPOWERNS) including historical and projected figures.
- Step 3: Modify the key assumptions (indicated in yellow cells) based on your analysis.
- Step 4: Observe the automatic recalculations reflecting RattanIndia Power Limited’s (RTNPOWERNS) intrinsic value.
- Step 5: Utilize the results for your investment decisions or reporting needs.
Why Choose This Calculator for RattanIndia Power Limited (RTNPOWERNS)?
- Accuracy: Powered by real financial data from RattanIndia ensures precise calculations.
- Flexibility: Tailored for users to experiment with and adjust inputs as desired.
- Time-Saving: Eliminate the need to create a DCF model from the ground up.
- Professional-Grade: Crafted with the expertise and usability expected at the CFO level.
- User-Friendly: Intuitive interface suitable for users regardless of their financial modeling background.
Who Can Benefit from This Product?
- Investors: Assess the valuation of RattanIndia Power Limited (RTNPOWERNS) prior to making investment decisions.
- CFOs and Financial Analysts: Optimize valuation processes and evaluate financial forecasts.
- Startup Founders: Gain insights into how established companies like RattanIndia Power are valued.
- Consultants: Provide detailed valuation reports to your clients based on RattanIndia Power's metrics.
- Students and Educators: Utilize real market data to practice and teach valuation methodologies.
Contents of the Template
- Comprehensive DCF Model: A customizable template featuring intricate valuation calculations.
- Real-World Data: Historical and projected financials of RattanIndia Power Limited (RTNPOWERNS) preloaded for in-depth analysis.
- Customizable Parameters: Modify WACC, growth rates, and tax assumptions to explore different scenarios.
- Financial Statements: Complete annual and quarterly breakdowns for thorough insights.
- Key Ratios: Integrated analysis focusing on profitability, efficiency, and financial leverage.
- Dashboard with Visual Outputs: Engaging charts and tables that present clear, actionable results.
Disclaimer
All information, articles, and product details provided on this website are for general informational and educational purposes only. We do not claim any ownership over, nor do we intend to infringe upon, any trademarks, copyrights, logos, brand names, or other intellectual property mentioned or depicted on this site. Such intellectual property remains the property of its respective owners, and any references here are made solely for identification or informational purposes, without implying any affiliation, endorsement, or partnership.
We make no representations or warranties, express or implied, regarding the accuracy, completeness, or suitability of any content or products presented. Nothing on this website should be construed as legal, tax, investment, financial, medical, or other professional advice. In addition, no part of this site—including articles or product references—constitutes a solicitation, recommendation, endorsement, advertisement, or offer to buy or sell any securities, franchises, or other financial instruments, particularly in jurisdictions where such activity would be unlawful.
All content is of a general nature and may not address the specific circumstances of any individual or entity. It is not a substitute for professional advice or services. Any actions you take based on the information provided here are strictly at your own risk. You accept full responsibility for any decisions or outcomes arising from your use of this website and agree to release us from any liability in connection with your use of, or reliance upon, the content or products found herein.