
|
Rail Vikas Nigam Limited (RVNL.NS) Évaluation DCF |
Entièrement Modifiable: Adapté À Vos Besoins Dans Excel Ou Sheets
Conception Professionnelle: Modèles Fiables Et Conformes Aux Normes Du Secteur
Pré-Construits Pour Une Utilisation Rapide Et Efficace
Compatible MAC/PC, entièrement débloqué
Aucune Expertise N'Est Requise; Facile À Suivre
Rail Vikas Nigam Limited (RVNL.NS) Bundle
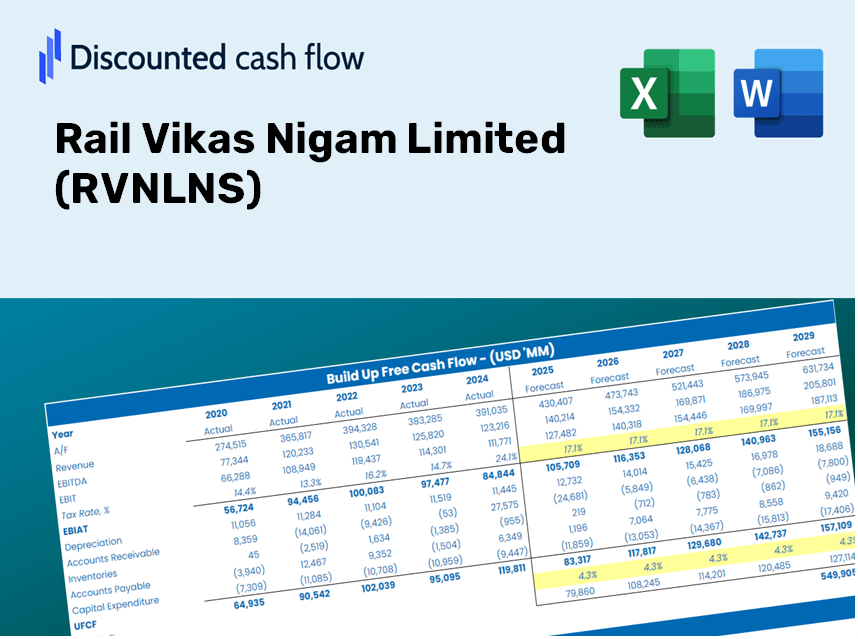
Évaluer les perspectives financières de Rail Vikas Nigam Limited (RVNLNS) comme un expert! Cette calculatrice (RVNLNS) DCF est livrée avec des données financières pré-remplies et offre une flexibilité totale pour modifier la croissance des revenus, le WACC, les marges et autres hypothèses essentielles pour s'aligner sur vos prévisions.
What You Will Receive
- Authentic RVNLNS Financials: Includes both historical and projected data for precise valuation.
- Customizable Inputs: Adjust WACC, tax rates, revenue growth, and capital expenditures to suit your analysis.
- Real-Time Calculations: Intrinsic value and NPV are computed automatically.
- Scenario Evaluation: Analyze various scenarios to assess the future performance of Rail Vikas Nigam Limited.
- User-Friendly and Professional Design: Designed for experts while remaining easy to use for newcomers.
Key Features
- Comprehensive RVNLNS Data: Pre-loaded with Rail Vikas Nigam Limited's historical performance and future growth estimates.
- Fully Customizable Inputs: Modify revenue growth rates, profit margins, cost of capital, tax percentages, and capital investments.
- Interactive Valuation Model: Automatically refreshes Net Present Value (NPV) and intrinsic value based on the adjustments you make.
- Scenario Analysis: Develop various forecast scenarios to explore different valuation possibilities.
- User-Friendly Interface: Intuitive layout designed for both experienced professionals and newcomers.
How It Works
- Step 1: Download the Excel file for Rail Vikas Nigam Limited (RVNLNS).
- Step 2: Examine the pre-filled financial data and forecasts for RVNLNS.
- Step 3: Adjust key inputs such as revenue growth, WACC, and tax rates (highlighted cells).
- Step 4: Observe the DCF model automatically update as you modify your assumptions.
- Step 5: Evaluate the outputs and leverage the results for your investment decisions.
Why Opt for RVNLNS Calculator?
- Efficiency Boost: Skip the hassle of building a DCF model; our calculator is ready to use.
- Enhanced Precision: Utilize trustworthy financial data and formulas to minimize valuation errors.
- Completely Adaptable: Customize the model to align with your own assumptions and forecasts.
- User-Friendly Results: Intuitive charts and outputs make analyses straightforward.
- Endorsed by Professionals: Crafted for experts who prioritize accuracy and ease of use.
Who Should Utilize Rail Vikas Nigam Limited (RVNLNS)?
- Investors: Accurately assess the fair value of Rail Vikas Nigam Limited (RVNLNS) prior to investment decisions.
- Chief Financial Officers: Utilize a high-quality DCF model for comprehensive financial reporting and analysis.
- Consultants: Efficiently tailor the valuation template for client reports related to Rail Vikas Nigam Limited (RVNLNS).
- Entrepreneurs: Acquire knowledge of financial modeling practices employed by leading companies.
- Educators: Implement it as a resource for teaching valuation techniques and methodologies.
Contents of the Template
- Historical Data: Comprises Rail Vikas Nigam Limited's (RVNLNS) previous financial results and foundational forecasts.
- DCF and Levered DCF Models: Comprehensive templates for determining the intrinsic value of Rail Vikas Nigam Limited (RVNLNS).
- WACC Sheet: Ready-to-use calculations for Weighted Average Cost of Capital.
- Editable Inputs: Customize essential drivers such as growth rates, EBITDA %, and CAPEX assumptions.
- Quarterly and Annual Statements: An exhaustive overview of Rail Vikas Nigam Limited's (RVNLNS) financial performance.
- Interactive Dashboard: Dynamically visualize valuation outcomes and projections.
Disclaimer
All information, articles, and product details provided on this website are for general informational and educational purposes only. We do not claim any ownership over, nor do we intend to infringe upon, any trademarks, copyrights, logos, brand names, or other intellectual property mentioned or depicted on this site. Such intellectual property remains the property of its respective owners, and any references here are made solely for identification or informational purposes, without implying any affiliation, endorsement, or partnership.
We make no representations or warranties, express or implied, regarding the accuracy, completeness, or suitability of any content or products presented. Nothing on this website should be construed as legal, tax, investment, financial, medical, or other professional advice. In addition, no part of this site—including articles or product references—constitutes a solicitation, recommendation, endorsement, advertisement, or offer to buy or sell any securities, franchises, or other financial instruments, particularly in jurisdictions where such activity would be unlawful.
All content is of a general nature and may not address the specific circumstances of any individual or entity. It is not a substitute for professional advice or services. Any actions you take based on the information provided here are strictly at your own risk. You accept full responsibility for any decisions or outcomes arising from your use of this website and agree to release us from any liability in connection with your use of, or reliance upon, the content or products found herein.