
|
Salem Media Group, Inc. (SALM) Valation DCF |
Entièrement Modifiable: Adapté À Vos Besoins Dans Excel Ou Sheets
Conception Professionnelle: Modèles Fiables Et Conformes Aux Normes Du Secteur
Pré-Construits Pour Une Utilisation Rapide Et Efficace
Compatible MAC/PC, entièrement débloqué
Aucune Expertise N'Est Requise; Facile À Suivre
Salem Media Group, Inc. (SALM) Bundle
Découvrez le véritable potentiel de Salem Media Group, Inc. (SALM) avec notre calculatrice avancée DCF! Personnalisez les hypothèses essentielles, explorez divers scénarios et évaluez comment les ajustements affectent l'évaluation de Salem Media Group, Inc. (SALM) - le tout dans un modèle Excel complet.
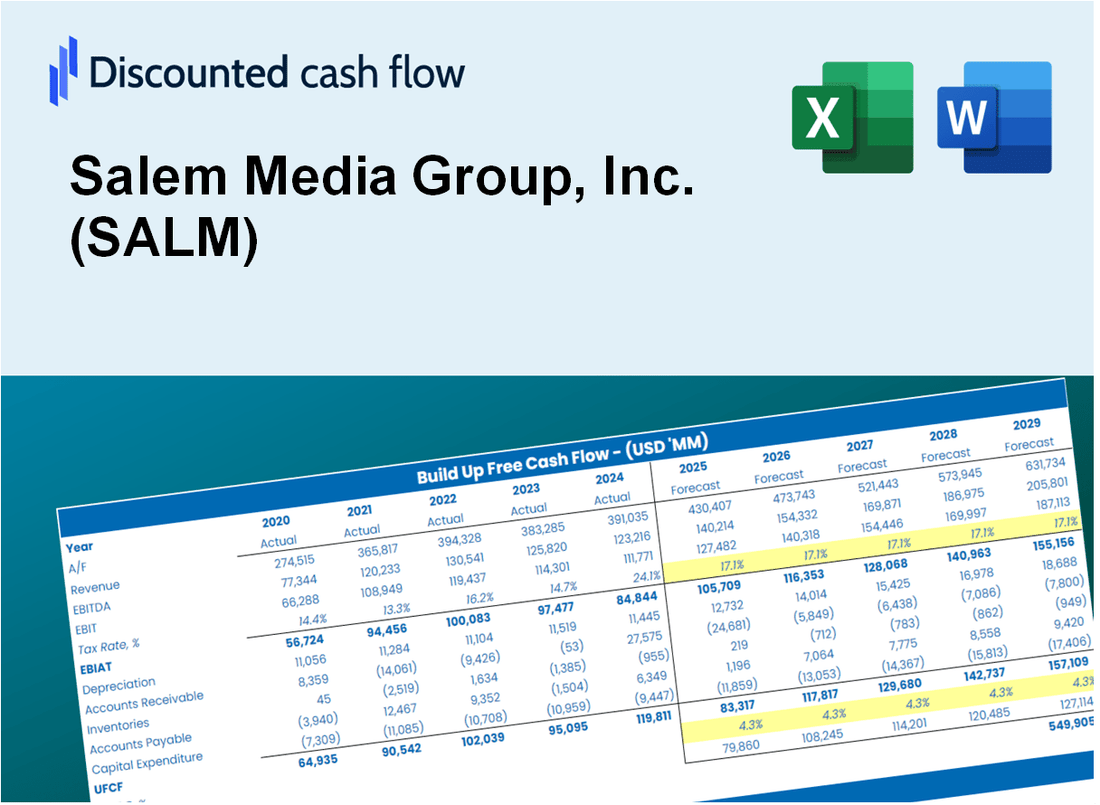
Discounted Cash Flow (DCF) - (USD MM)
| Year | AY1 2020 |
AY2 2021 |
AY3 2022 |
AY4 2023 |
AY5 2024 |
FY1 2025 |
FY2 2026 |
FY3 2027 |
FY4 2028 |
FY5 2029 |
|---|---|---|---|---|---|---|---|---|---|---|
| Revenue | 236.2 | 258.2 | 267.0 | 258.7 | 237.6 | 235.7 | 233.8 | 232.0 | 230.2 | 228.4 |
| Revenue Growth, % | 0 | 9.32 | 3.38 | -3.11 | -8.15 | -0.78674 | -0.78674 | -0.78674 | -0.78674 | -0.78674 |
| EBITDA | 15.3 | 78.1 | 22.0 | -32.8 | 35.2 | 22.2 | 22.0 | 21.9 | 21.7 | 21.5 |
| EBITDA, % | 6.48 | 30.24 | 8.26 | -12.67 | 14.83 | 9.43 | 9.43 | 9.43 | 9.43 | 9.43 |
| Depreciation | 23.0 | 21.5 | 12.6 | 13.6 | 12.0 | 15.6 | 15.5 | 15.4 | 15.2 | 15.1 |
| Depreciation, % | 9.74 | 8.34 | 4.72 | 5.27 | 5.04 | 6.62 | 6.62 | 6.62 | 6.62 | 6.62 |
| EBIT | -7.7 | 56.6 | 9.4 | -46.4 | 23.3 | 6.6 | 6.6 | 6.5 | 6.5 | 6.4 |
| EBIT, % | -3.26 | 21.9 | 3.53 | -17.94 | 9.79 | 2.8 | 2.8 | 2.8 | 2.8 | 2.8 |
| Total Cash | 6.3 | 1.8 | .0 | .3 | .0 | 1.6 | 1.6 | 1.6 | 1.6 | 1.6 |
| Total Cash, percent | .0 | .0 | .0 | .0 | .0 | .0 | .0 | .0 | .0 | .0 |
| Account Receivables | 28.8 | 30.4 | 35.7 | 36.1 | 32.6 | 30.7 | 30.4 | 30.2 | 29.9 | 29.7 |
| Account Receivables, % | 12.18 | 11.79 | 13.36 | 13.98 | 13.72 | 13.01 | 13.01 | 13.01 | 13.01 | 13.01 |
| Inventories | .5 | 1.0 | 1.5 | .0 | .0 | .5 | .5 | .5 | .5 | .5 |
| Inventories, % | 0.20953 | 0.37174 | 0.56674 | 0 | 0 | 0.2296 | 0.2296 | 0.2296 | 0.2296 | 0.2296 |
| Accounts Payable | 2.0 | 2.7 | 6.5 | 5.4 | 5.7 | 4.2 | 4.1 | 4.1 | 4.1 | 4.0 |
| Accounts Payable, % | 0.84914 | 1.03 | 2.45 | 2.09 | 2.39 | 1.76 | 1.76 | 1.76 | 1.76 | 1.76 |
| Capital Expenditure | -4.8 | -10.9 | -13.4 | -14.6 | -6.0 | -9.2 | -9.1 | -9.0 | -8.9 | -8.9 |
| Capital Expenditure, % | -2.02 | -4.23 | -5.01 | -5.66 | -2.51 | -3.88 | -3.88 | -3.88 | -3.88 | -3.88 |
| Tax Rate, % | -93.69 | -93.69 | -93.69 | -93.69 | -93.69 | -93.69 | -93.69 | -93.69 | -93.69 | -93.69 |
| EBITAT | -17.5 | 57.6 | 8.4 | -33.1 | 45.0 | 6.1 | 6.0 | 6.0 | 5.9 | 5.9 |
| Depreciation | ||||||||||
| Changes in Account Receivables | ||||||||||
| Changes in Inventories | ||||||||||
| Changes in Accounts Payable | ||||||||||
| Capital Expenditure | ||||||||||
| UFCF | -26.6 | 66.8 | 5.8 | -34.2 | 54.9 | 12.4 | 12.7 | 12.6 | 12.5 | 12.4 |
| WACC, % | 9.41 | 9.41 | 8.45 | 6.85 | 9.41 | 8.71 | 8.71 | 8.71 | 8.71 | 8.71 |
| PV UFCF | ||||||||||
| SUM PV UFCF | 49.0 | |||||||||
| Long Term Growth Rate, % | 3.50 | |||||||||
| Free cash flow (T + 1) | 13 | |||||||||
| Terminal Value | 246 | |||||||||
| Present Terminal Value | 162 | |||||||||
| Enterprise Value | 211 | |||||||||
| Net Debt | 150 | |||||||||
| Equity Value | 60 | |||||||||
| Diluted Shares Outstanding, MM | 28 | |||||||||
| Equity Value Per Share | 2.17 |
What You Will Get
- Comprehensive SALM Financials: Access historical and projected data for precise valuation.
- Customizable Inputs: Adjust WACC, tax rates, revenue growth, and capital expenditures as needed.
- Real-Time Calculations: Intrinsic value and NPV are updated automatically.
- Scenario Analysis: Explore various scenarios to assess Salem Media Group's future performance.
- User-Friendly Design: Designed for professionals while remaining easy for newcomers to navigate.
Key Features
- 🔍 Real-Life SALM Financials: Pre-filled historical and projected data for Salem Media Group, Inc.
- ✏️ Fully Customizable Inputs: Adjust all critical parameters (yellow cells) like WACC, growth %, and tax rates.
- 📊 Professional DCF Valuation: Built-in formulas calculate Salem's intrinsic value using the Discounted Cash Flow method.
- ⚡ Instant Results: Visualize Salem's valuation instantly after making changes.
- Scenario Analysis: Test and compare outcomes for various financial assumptions side-by-side.
How It Works
- Download: Obtain the pre-prepared Excel file containing Salem Media Group, Inc.'s (SALM) financial data.
- Customize: Modify forecasts such as revenue growth, EBITDA %, and WACC to fit your analysis.
- Update Automatically: Watch as the intrinsic value and NPV calculations refresh in real-time.
- Test Scenarios: Develop various projections and instantly compare the results.
- Make Decisions: Leverage the valuation outcomes to inform your investment strategies.
Why Choose Salem Media Group, Inc. (SALM)?
- Extensive Reach: Benefit from a wide audience across various media platforms.
- Quality Content: Access a diverse range of programming that engages and informs.
- Proven Track Record: A history of success in delivering impactful media solutions.
- Innovative Strategies: Leverage cutting-edge marketing techniques to maximize visibility.
- Expert Team: Work with industry professionals dedicated to achieving your goals.
Who Should Use This Product?
- Media Investors: Develop comprehensive and accurate valuation models for analyzing investments in Salem Media Group, Inc. (SALM).
- Corporate Strategy Teams: Evaluate valuation scenarios to inform strategic decisions within the media industry.
- Consultants and Advisors: Deliver precise valuation insights for clients interested in Salem Media Group, Inc. (SALM).
- Students and Educators: Utilize real-world data to enhance learning and practice in financial modeling related to media companies.
- Media Analysts: Gain a deeper understanding of how companies like Salem Media Group, Inc. (SALM) are valued in the marketplace.
What the Template Contains
- Pre-Filled Data: Contains Salem Media Group’s historical financials and projections.
- Discounted Cash Flow Model: Editable DCF valuation model featuring automatic calculations.
- Weighted Average Cost of Capital (WACC): A dedicated sheet for calculating WACC using custom inputs.
- Key Financial Ratios: Evaluate Salem Media Group’s profitability, efficiency, and leverage.
- Customizable Inputs: Easily modify revenue growth, margins, and tax rates.
- Clear Dashboard: Visuals and tables summarizing essential valuation outcomes.
Disclaimer
All information, articles, and product details provided on this website are for general informational and educational purposes only. We do not claim any ownership over, nor do we intend to infringe upon, any trademarks, copyrights, logos, brand names, or other intellectual property mentioned or depicted on this site. Such intellectual property remains the property of its respective owners, and any references here are made solely for identification or informational purposes, without implying any affiliation, endorsement, or partnership.
We make no representations or warranties, express or implied, regarding the accuracy, completeness, or suitability of any content or products presented. Nothing on this website should be construed as legal, tax, investment, financial, medical, or other professional advice. In addition, no part of this site—including articles or product references—constitutes a solicitation, recommendation, endorsement, advertisement, or offer to buy or sell any securities, franchises, or other financial instruments, particularly in jurisdictions where such activity would be unlawful.
All content is of a general nature and may not address the specific circumstances of any individual or entity. It is not a substitute for professional advice or services. Any actions you take based on the information provided here are strictly at your own risk. You accept full responsibility for any decisions or outcomes arising from your use of this website and agree to release us from any liability in connection with your use of, or reliance upon, the content or products found herein.