
|
Le manganèse Sandur & Iron Ores Limited (Sanduma.NS) Évaluation DCF |
Entièrement Modifiable: Adapté À Vos Besoins Dans Excel Ou Sheets
Conception Professionnelle: Modèles Fiables Et Conformes Aux Normes Du Secteur
Pré-Construits Pour Une Utilisation Rapide Et Efficace
Compatible MAC/PC, entièrement débloqué
Aucune Expertise N'Est Requise; Facile À Suivre
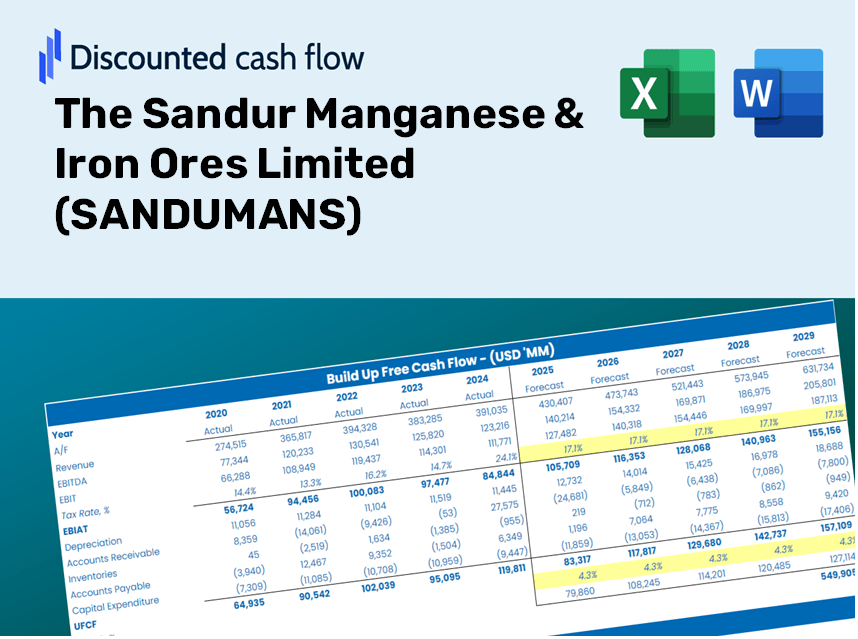
The Sandur Manganese & Iron Ores Limited (SANDUMA.NS) Bundle
Améliorez vos stratégies d'investissement avec la calculatrice (Sandumans) DCF! Explorez des données financières authentiques pour le manganèse Sandur & Iron Ores Limited, ajustez les projections et dépenses de croissance et observez instantanément comment ces modifications affectent la valeur intrinsèque de (Sandumans).
Discounted Cash Flow (DCF) - (USD MM)
| Year | AY1 2021 |
AY2 2022 |
AY3 2023 |
AY4 2024 |
AY5 2025 |
FY1 2026 |
FY2 2027 |
FY3 2028 |
FY4 2029 |
FY5 2030 |
|---|---|---|---|---|---|---|---|---|---|---|
| Revenue | 7,471.4 | 22,491.2 | 21,258.1 | 12,378.4 | 31,350.6 | 43,322.3 | 59,865.7 | 82,726.3 | 114,316.7 | 157,970.3 |
| Revenue Growth, % | 0 | 201.03 | -5.48 | -41.77 | 153.27 | 38.19 | 38.19 | 38.19 | 38.19 | 38.19 |
| EBITDA | 2,894.1 | 10,093.6 | 4,516.1 | 4,027.0 | 8,618.6 | 14,286.1 | 19,741.4 | 27,280.0 | 37,697.3 | 52,092.6 |
| EBITDA, % | 38.74 | 44.88 | 21.24 | 32.53 | 27.49 | 32.98 | 32.98 | 32.98 | 32.98 | 32.98 |
| Depreciation | 268.1 | 556.0 | 642.6 | 578.4 | 1,207.6 | 1,525.7 | 2,108.3 | 2,913.4 | 4,025.9 | 5,563.2 |
| Depreciation, % | 3.59 | 2.47 | 3.02 | 4.67 | 3.85 | 3.52 | 3.52 | 3.52 | 3.52 | 3.52 |
| EBIT | 2,625.9 | 9,537.6 | 3,873.5 | 3,448.6 | 7,411.0 | 12,760.4 | 17,633.1 | 24,366.6 | 33,671.4 | 46,529.4 |
| EBIT, % | 35.15 | 42.41 | 18.22 | 27.86 | 23.64 | 29.45 | 29.45 | 29.45 | 29.45 | 29.45 |
| Total Cash | 3,566.4 | 5,553.7 | 4,807.9 | 4,672.2 | 4,205.1 | 12,667.5 | 17,504.8 | 24,189.3 | 33,426.4 | 46,190.8 |
| Total Cash, percent | .0 | .0 | .0 | .0 | .0 | .0 | .0 | .0 | .0 | .0 |
| Account Receivables | 802.4 | 2,108.8 | 1,629.5 | 344.1 | 3,754.9 | 3,685.7 | 5,093.1 | 7,038.0 | 9,725.6 | 13,439.5 |
| Account Receivables, % | 10.74 | 9.38 | 7.67 | 2.78 | 11.98 | 8.51 | 8.51 | 8.51 | 8.51 | 8.51 |
| Inventories | 1,569.8 | 3,112.9 | 2,918.8 | 3,882.4 | 9,519.2 | 9,557.7 | 13,207.5 | 18,251.0 | 25,220.4 | 34,851.3 |
| Inventories, % | 21.01 | 13.84 | 13.73 | 31.36 | 30.36 | 22.06 | 22.06 | 22.06 | 22.06 | 22.06 |
| Accounts Payable | 2,223.5 | 5,696.1 | 1,929.0 | 1,345.2 | 7,467.6 | 8,564.5 | 11,835.0 | 16,354.4 | 22,599.6 | 31,229.7 |
| Accounts Payable, % | 29.76 | 25.33 | 9.07 | 10.87 | 23.82 | 19.77 | 19.77 | 19.77 | 19.77 | 19.77 |
| Capital Expenditure | -601.1 | -779.4 | -1,873.8 | -1,028.0 | -875.1 | -2,722.4 | -3,762.0 | -5,198.6 | -7,183.8 | -9,927.0 |
| Capital Expenditure, % | -8.04 | -3.47 | -8.81 | -8.3 | -2.79 | -6.28 | -6.28 | -6.28 | -6.28 | -6.28 |
| Tax Rate, % | 24.18 | 24.18 | 24.18 | 24.18 | 24.18 | 24.18 | 24.18 | 24.18 | 24.18 | 24.18 |
| EBITAT | 1,619.9 | 7,034.6 | 2,917.6 | 2,540.8 | 5,618.8 | 9,194.1 | 12,705.0 | 17,556.5 | 24,260.8 | 33,525.2 |
| Depreciation | ||||||||||
| Changes in Account Receivables | ||||||||||
| Changes in Inventories | ||||||||||
| Changes in Accounts Payable | ||||||||||
| Capital Expenditure | ||||||||||
| UFCF | 1,138.2 | 7,434.5 | -1,407.4 | 1,829.2 | 3,026.1 | 9,124.9 | 9,264.5 | 12,802.3 | 17,691.1 | 24,446.7 |
| WACC, % | 6.42 | 6.68 | 6.71 | 6.68 | 6.72 | 6.64 | 6.64 | 6.64 | 6.64 | 6.64 |
| PV UFCF | ||||||||||
| SUM PV UFCF | 58,662.2 | |||||||||
| Long Term Growth Rate, % | 2.00 | |||||||||
| Free cash flow (T + 1) | 24,936 | |||||||||
| Terminal Value | 537,166 | |||||||||
| Present Terminal Value | 389,462 | |||||||||
| Enterprise Value | 448,125 | |||||||||
| Net Debt | 18,758 | |||||||||
| Equity Value | 429,367 | |||||||||
| Diluted Shares Outstanding, MM | 162 | |||||||||
| Equity Value Per Share | 2,648.40 |
Benefits You'll Receive
- Authentic SANDUMANS Financials: Access to both historical and projected data for precise valuation.
- Customizable Inputs: Adjust WACC, tax rates, revenue growth, and capital expenditures to suit your analysis.
- Automated Calculations: Get real-time calculations for intrinsic value and NPV.
- Scenario Analysis: Explore various scenarios to assess the future potential of Sandur Manganese & Iron Ores.
- User-Friendly Interface: Designed for professionals while remaining accessible to newcomers.
Key Features of The Sandur Manganese & Iron Ores Limited (SANDUMANS)
- Customizable Forecast Inputs: Adjust essential parameters such as revenue growth, EBITDA margin, and capital expenditures to fit your analysis.
- Instant DCF Valuation: Quickly computes intrinsic value, NPV, and various financial metrics in real-time.
- High-Quality Accuracy: Leverages The Sandur Manganese & Iron Ores Limited's actual financial data for reliable valuation results.
- Streamlined Scenario Analysis: Effortlessly evaluate different assumptions and compare the resulting impacts.
- Efficiency Booster: Avoid the complexities of building valuation models from the ground up and save valuable time.
How It Works
- Step 1: Download the prebuilt Excel template that includes data for The Sandur Manganese & Iron Ores Limited (SANDUMANS).
- Step 2: Review the pre-filled sheets to familiarize yourself with the essential metrics.
- Step 3: Adjust the forecasts and assumptions in the editable yellow cells (WACC, growth, margins).
- Step 4: Immediately see the updated results, which include the intrinsic value of The Sandur Manganese & Iron Ores Limited (SANDUMANS).
- Step 5: Use the outputs to make well-informed investment decisions or create reports.
Why Opt for This Calculator?
- User-Friendly Interface: Perfectly crafted for both novices and seasoned professionals.
- Customizable Inputs: Effortlessly adjust parameters to suit your analysis needs.
- Real-Time Updates: Instantly view changes in Sandur Manganese & Iron Ores Limited's (SANDUMANS) valuation as you tweak inputs.
- Pre-Configured Data: Comes equipped with the latest financial information for swift evaluations.
- Respected by Experts: A trusted tool for investors and analysts making well-informed choices.
Who Should Use This Product?
- Finance Students: Explore valuation methodologies and apply them to real-world data, including insights on The Sandur Manganese & Iron Ores Limited (SANDUMANS).
- Academics: Integrate advanced financial models into your teaching or research focused on mining and resources.
- Investors: Validate your investment strategies and analyze valuation results for The Sandur Manganese & Iron Ores Limited (SANDUMANS).
- Analysts: Enhance your analysis with a customizable DCF model tailored for resources companies like The Sandur Manganese & Iron Ores Limited (SANDUMANS).
- Small Business Owners: Discover how industry leaders are evaluated, using The Sandur Manganese & Iron Ores Limited (SANDUMANS) as a case study.
Contents of the Template
- Historical Data: A comprehensive overview of The Sandur Manganese & Iron Ores Limited’s (SANDUMANS) past financial performance and baseline forecasts.
- DCF and Levered DCF Models: In-depth templates for evaluating the intrinsic value of The Sandur Manganese & Iron Ores Limited (SANDUMANS).
- WACC Sheet: Pre-configured calculations for the Weighted Average Cost of Capital.
- Editable Inputs: Customize key factors including growth rates, EBITDA percentages, and capital expenditure assumptions.
- Quarterly and Annual Statements: A thorough breakdown of The Sandur Manganese & Iron Ores Limited’s (SANDUMANS) financials.
- Interactive Dashboard: Dynamically visualize valuation outcomes and projections.
Disclaimer
All information, articles, and product details provided on this website are for general informational and educational purposes only. We do not claim any ownership over, nor do we intend to infringe upon, any trademarks, copyrights, logos, brand names, or other intellectual property mentioned or depicted on this site. Such intellectual property remains the property of its respective owners, and any references here are made solely for identification or informational purposes, without implying any affiliation, endorsement, or partnership.
We make no representations or warranties, express or implied, regarding the accuracy, completeness, or suitability of any content or products presented. Nothing on this website should be construed as legal, tax, investment, financial, medical, or other professional advice. In addition, no part of this site—including articles or product references—constitutes a solicitation, recommendation, endorsement, advertisement, or offer to buy or sell any securities, franchises, or other financial instruments, particularly in jurisdictions where such activity would be unlawful.
All content is of a general nature and may not address the specific circumstances of any individual or entity. It is not a substitute for professional advice or services. Any actions you take based on the information provided here are strictly at your own risk. You accept full responsibility for any decisions or outcomes arising from your use of this website and agree to release us from any liability in connection with your use of, or reliance upon, the content or products found herein.