
|
S&W Seed Company (SANW) Évaluation DCF |
Entièrement Modifiable: Adapté À Vos Besoins Dans Excel Ou Sheets
Conception Professionnelle: Modèles Fiables Et Conformes Aux Normes Du Secteur
Pré-Construits Pour Une Utilisation Rapide Et Efficace
Compatible MAC/PC, entièrement débloqué
Aucune Expertise N'Est Requise; Facile À Suivre
S&W Seed Company (SANW) Bundle
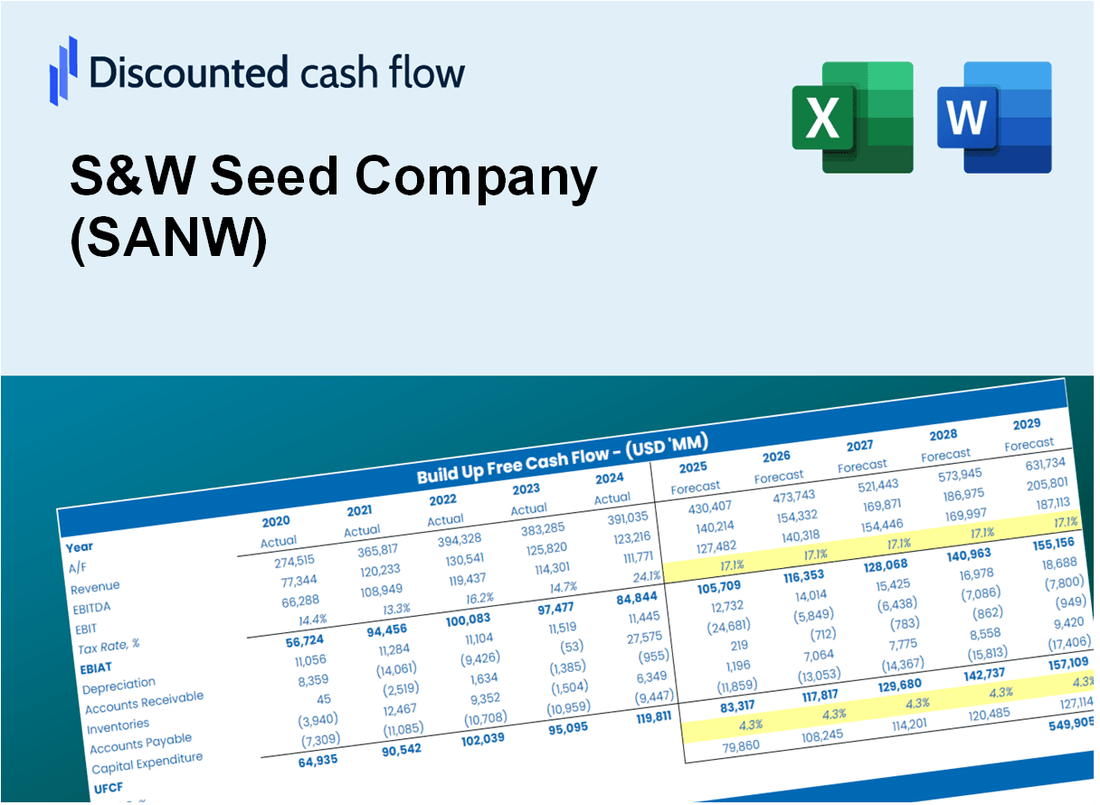
Rationalisez votre analyse et améliorez la précision avec notre calculatrice (SANW) DCF! En utilisant des données réelles de S&W Seed Company et des hypothèses personnalisables, cet outil vous permet de prévoir, analyser et valoriser (SANW) comme un investisseur chevronné.
Discounted Cash Flow (DCF) - (USD MM)
| Year | AY1 2020 |
AY2 2021 |
AY3 2022 |
AY4 2023 |
AY5 2024 |
FY1 2025 |
FY2 2026 |
FY3 2027 |
FY4 2028 |
FY5 2029 |
|---|---|---|---|---|---|---|---|---|---|---|
| Revenue | 79.6 | 84.0 | 71.4 | 73.5 | 60.4 | 56.8 | 53.3 | 50.1 | 47.1 | 44.2 |
| Revenue Growth, % | 0 | 5.61 | -15.1 | 3.04 | -17.79 | -6.06 | -6.06 | -6.06 | -6.06 | -6.06 |
| EBITDA | -11.8 | -10.7 | -27.3 | 25.9 | -15.0 | -6.3 | -5.9 | -5.6 | -5.2 | -4.9 |
| EBITDA, % | -14.83 | -12.72 | -38.31 | 35.16 | -24.83 | -11.1 | -11.1 | -11.1 | -11.1 | -11.1 |
| Depreciation | 5.0 | 5.5 | 5.5 | 4.8 | 4.3 | 3.9 | 3.6 | 3.4 | 3.2 | 3.0 |
| Depreciation, % | 6.33 | 6.51 | 7.65 | 6.49 | 7.1 | 6.81 | 6.81 | 6.81 | 6.81 | 6.81 |
| EBIT | -16.8 | -16.2 | -32.8 | 21.1 | -19.3 | -10.2 | -9.6 | -9.0 | -8.4 | -7.9 |
| EBIT, % | -21.15 | -19.22 | -45.97 | 28.68 | -31.93 | -17.92 | -17.92 | -17.92 | -17.92 | -17.92 |
| Total Cash | 4.1 | 3.5 | 2.1 | 3.4 | .3 | 2.0 | 1.9 | 1.7 | 1.6 | 1.5 |
| Total Cash, percent | .0 | .0 | .0 | .0 | .0 | .0 | .0 | .0 | .0 | .0 |
| Account Receivables | 19.0 | 19.4 | 19.1 | 31.5 | 20.9 | 17.1 | 16.1 | 15.1 | 14.2 | 13.4 |
| Account Receivables, % | 23.9 | 23.07 | 26.7 | 42.8 | 34.52 | 30.2 | 30.2 | 30.2 | 30.2 | 30.2 |
| Inventories | 63.9 | 63.4 | 54.5 | 45.1 | 38.1 | 40.5 | 38.0 | 35.7 | 33.6 | 31.5 |
| Inventories, % | 80.27 | 75.43 | 76.4 | 61.34 | 63.05 | 71.3 | 71.3 | 71.3 | 71.3 | 71.3 |
| Accounts Payable | 8.0 | 15.9 | 15.9 | 13.3 | 13.5 | 10.4 | 9.8 | 9.2 | 8.6 | 8.1 |
| Accounts Payable, % | 10.11 | 18.97 | 22.28 | 18.11 | 22.32 | 18.36 | 18.36 | 18.36 | 18.36 | 18.36 |
| Capital Expenditure | -2.0 | -1.1 | -2.1 | -1.0 | -1.5 | -1.2 | -1.1 | -1.1 | -1.0 | -.9 |
| Capital Expenditure, % | -2.48 | -1.28 | -2.94 | -1.4 | -2.55 | -2.13 | -2.13 | -2.13 | -2.13 | -2.13 |
| Tax Rate, % | -1.59 | -1.59 | -1.59 | -1.59 | -1.59 | -1.59 | -1.59 | -1.59 | -1.59 | -1.59 |
| EBITAT | -17.2 | -16.1 | -33.2 | 22.2 | -19.6 | -10.2 | -9.6 | -9.0 | -8.4 | -7.9 |
| Depreciation | ||||||||||
| Changes in Account Receivables | ||||||||||
| Changes in Inventories | ||||||||||
| Changes in Accounts Payable | ||||||||||
| Capital Expenditure | ||||||||||
| UFCF | -89.0 | -3.7 | -20.6 | 20.4 | .9 | -9.2 | -4.2 | -3.9 | -3.7 | -3.5 |
| WACC, % | 13.62 | 13.6 | 13.62 | 13.62 | 13.62 | 13.61 | 13.61 | 13.61 | 13.61 | 13.61 |
| PV UFCF | ||||||||||
| SUM PV UFCF | -18.1 | |||||||||
| Long Term Growth Rate, % | 2.00 | |||||||||
| Free cash flow (T + 1) | -4 | |||||||||
| Terminal Value | -31 | |||||||||
| Present Terminal Value | -16 | |||||||||
| Enterprise Value | -34 | |||||||||
| Net Debt | 54 | |||||||||
| Equity Value | -88 | |||||||||
| Diluted Shares Outstanding, MM | 2 | |||||||||
| Equity Value Per Share | -38.84 |
What You Will Get
- Comprehensive SANW Financials: Access historical and projected data for precise valuation.
- Customizable Parameters: Adjust WACC, tax rates, revenue growth, and capital investments.
- Real-Time Calculations: Intrinsic value and NPV are updated automatically.
- Scenario Modeling: Explore various scenarios to assess S&W Seed Company's future performance.
- User-Friendly Interface: Designed for professionals while remaining approachable for newcomers.
Key Features
- Comprehensive Data: S&W Seed Company's historical financial data and pre-populated projections.
- Customizable Inputs: Adjust WACC, tax rates, revenue growth, and EBITDA margins as needed.
- Real-Time Calculations: Watch S&W Seed Company's intrinsic value update instantly.
- Intuitive Visual Outputs: Dashboard graphs illustrate valuation results and essential metrics.
- Designed for Precision: A reliable tool for analysts, investors, and finance professionals.
How It Works
- Step 1: Download the Excel file.
- Step 2: Review pre-entered S&W Seed Company (SANW) data (historical and projected).
- Step 3: Adjust key assumptions (yellow cells) based on your analysis.
- Step 4: View automatic recalculations for S&W Seed Company’s intrinsic value.
- Step 5: Use the outputs for investment decisions or reporting.
Why Choose S&W Seed Company (SANW)?
- Innovative Solutions: Benefit from cutting-edge agricultural technologies tailored for modern farming.
- Quality Assurance: Our products undergo rigorous testing to ensure the highest standards.
- Expert Support: Access to knowledgeable professionals ready to assist with your needs.
- Sustainable Practices: Committed to environmentally friendly methods that promote sustainability.
- Proven Track Record: Trusted by farmers and agricultural businesses for reliable seed performance.
Who Should Use This Product?
- Agricultural Investors: Develop comprehensive and accurate valuation models for investment analysis in S&W Seed Company (SANW).
- Corporate Finance Teams: Evaluate valuation scenarios to inform strategic decisions within agricultural sectors.
- Consultants and Advisors: Offer clients precise valuation insights related to S&W Seed Company (SANW).
- Students and Educators: Utilize real-world agricultural data to enhance learning and practice in financial modeling.
- Industry Enthusiasts: Gain insights into the valuation processes of agricultural companies like S&W Seed Company (SANW).
What the Template Contains
- Comprehensive DCF Model: Editable template featuring detailed valuation calculations tailored for S&W Seed Company (SANW).
- Real-World Data: S&W Seed Company's historical and projected financials preloaded for thorough analysis.
- Customizable Parameters: Modify WACC, growth rates, and tax assumptions to explore various scenarios.
- Financial Statements: Complete annual and quarterly breakdowns for enhanced insights into the company's performance.
- Key Ratios: Integrated analysis for assessing profitability, efficiency, and leverage specific to S&W Seed Company (SANW).
- Dashboard with Visual Outputs: Visualizations and tables providing clear, actionable results for decision-making.
Disclaimer
All information, articles, and product details provided on this website are for general informational and educational purposes only. We do not claim any ownership over, nor do we intend to infringe upon, any trademarks, copyrights, logos, brand names, or other intellectual property mentioned or depicted on this site. Such intellectual property remains the property of its respective owners, and any references here are made solely for identification or informational purposes, without implying any affiliation, endorsement, or partnership.
We make no representations or warranties, express or implied, regarding the accuracy, completeness, or suitability of any content or products presented. Nothing on this website should be construed as legal, tax, investment, financial, medical, or other professional advice. In addition, no part of this site—including articles or product references—constitutes a solicitation, recommendation, endorsement, advertisement, or offer to buy or sell any securities, franchises, or other financial instruments, particularly in jurisdictions where such activity would be unlawful.
All content is of a general nature and may not address the specific circumstances of any individual or entity. It is not a substitute for professional advice or services. Any actions you take based on the information provided here are strictly at your own risk. You accept full responsibility for any decisions or outcomes arising from your use of this website and agree to release us from any liability in connection with your use of, or reliance upon, the content or products found herein.