
|
Sarda énergie & Minerals Limited (Sardaen.NS) Évaluation DCF |
Entièrement Modifiable: Adapté À Vos Besoins Dans Excel Ou Sheets
Conception Professionnelle: Modèles Fiables Et Conformes Aux Normes Du Secteur
Pré-Construits Pour Une Utilisation Rapide Et Efficace
Compatible MAC/PC, entièrement débloqué
Aucune Expertise N'Est Requise; Facile À Suivre
Sarda Energy & Minerals Limited (SARDAEN.NS) Bundle
Découvrez la vraie valeur de Sarda Energy & Minerals Limited (Sardaenns) avec notre calculatrice avancée DCF! Ajustez les hypothèses critiques, explorez divers scénarios et évaluez comment les changements affectent l'évaluation de l'énergie de Sarda & Minerals Limited (Sardaenns) - le tout dans un modèle Excel facile à utiliser.
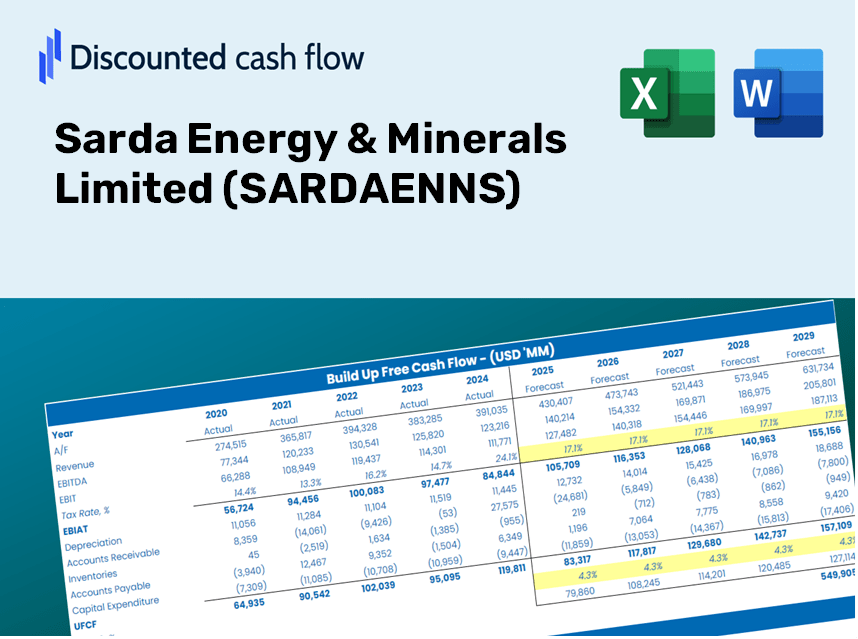
Discounted Cash Flow (DCF) - (USD MM)
| Year | AY1 2021 |
AY2 2022 |
AY3 2023 |
AY4 2024 |
AY5 2025 |
FY1 2026 |
FY2 2027 |
FY3 2028 |
FY4 2029 |
FY5 2030 |
|---|---|---|---|---|---|---|---|---|---|---|
| Revenue | 21,988.1 | 39,194.9 | 42,156.4 | 38,818.5 | 46,650.7 | 58,088.2 | 72,329.9 | 90,063.3 | 112,144.5 | 139,639.3 |
| Revenue Growth, % | 0 | 78.26 | 7.56 | -7.92 | 20.18 | 24.52 | 24.52 | 24.52 | 24.52 | 24.52 |
| EBITDA | 5,052.2 | 13,447.5 | 10,556.2 | 8,004.2 | 12,481.5 | 15,068.3 | 18,762.6 | 23,362.7 | 29,090.6 | 36,222.9 |
| EBITDA, % | 22.98 | 34.31 | 25.04 | 20.62 | 26.76 | 25.94 | 25.94 | 25.94 | 25.94 | 25.94 |
| Depreciation | 749.1 | 1,429.9 | 1,784.6 | 1,831.3 | 2,709.9 | 2,534.4 | 3,155.7 | 3,929.4 | 4,892.8 | 6,092.4 |
| Depreciation, % | 3.41 | 3.65 | 4.23 | 4.72 | 5.81 | 4.36 | 4.36 | 4.36 | 4.36 | 4.36 |
| EBIT | 4,303.1 | 12,017.6 | 8,771.6 | 6,172.9 | 9,771.6 | 12,533.9 | 15,606.9 | 19,433.3 | 24,197.8 | 30,130.5 |
| EBIT, % | 19.57 | 30.66 | 20.81 | 15.9 | 20.95 | 21.58 | 21.58 | 21.58 | 21.58 | 21.58 |
| Total Cash | 3,116.2 | 7,326.7 | 7,973.2 | 13,256.6 | 12,568.7 | 13,112.9 | 16,327.9 | 20,331.1 | 25,315.7 | 31,522.4 |
| Total Cash, percent | .0 | .0 | .0 | .0 | .0 | .0 | .0 | .0 | .0 | .0 |
| Account Receivables | 4,459.3 | 5,998.2 | 5,465.0 | 5,881.7 | 6,991.9 | 9,141.6 | 11,382.9 | 14,173.7 | 17,648.7 | 21,975.7 |
| Account Receivables, % | 20.28 | 15.3 | 12.96 | 15.15 | 14.99 | 15.74 | 15.74 | 15.74 | 15.74 | 15.74 |
| Inventories | 5,789.6 | 6,129.7 | 7,271.2 | 5,283.9 | 8,087.8 | 10,475.2 | 13,043.5 | 16,241.4 | 20,223.4 | 25,181.6 |
| Inventories, % | 26.33 | 15.64 | 17.25 | 13.61 | 17.34 | 18.03 | 18.03 | 18.03 | 18.03 | 18.03 |
| Accounts Payable | 2,053.5 | 2,122.4 | 1,347.1 | 1,726.1 | 1,943.9 | 3,086.0 | 3,842.6 | 4,784.7 | 5,957.8 | 7,418.5 |
| Accounts Payable, % | 9.34 | 5.41 | 3.2 | 4.45 | 4.17 | 5.31 | 5.31 | 5.31 | 5.31 | 5.31 |
| Capital Expenditure | -3,039.7 | -2,821.6 | -2,167.5 | -2,655.2 | -4,903.2 | -5,055.4 | -6,294.9 | -7,838.3 | -9,760.0 | -12,152.9 |
| Capital Expenditure, % | -13.82 | -7.2 | -5.14 | -6.84 | -10.51 | -8.7 | -8.7 | -8.7 | -8.7 | -8.7 |
| Tax Rate, % | 25.45 | 25.45 | 25.45 | 25.45 | 25.45 | 25.45 | 25.45 | 25.45 | 25.45 | 25.45 |
| EBITAT | 3,282.9 | 8,734.0 | 6,554.5 | 4,728.4 | 7,284.5 | 9,396.4 | 11,700.1 | 14,568.7 | 18,140.5 | 22,588.1 |
| Depreciation | ||||||||||
| Changes in Account Receivables | ||||||||||
| Changes in Inventories | ||||||||||
| Changes in Accounts Payable | ||||||||||
| Capital Expenditure | ||||||||||
| UFCF | -7,203.1 | 5,532.2 | 4,788.0 | 5,854.1 | 1,394.9 | 3,480.3 | 4,508.0 | 5,613.3 | 6,989.5 | 8,703.1 |
| WACC, % | 5.88 | 5.84 | 5.87 | 5.88 | 5.86 | 5.87 | 5.87 | 5.87 | 5.87 | 5.87 |
| PV UFCF | ||||||||||
| SUM PV UFCF | 24,148.5 | |||||||||
| Long Term Growth Rate, % | 3.00 | |||||||||
| Free cash flow (T + 1) | 8,964 | |||||||||
| Terminal Value | 312,597 | |||||||||
| Present Terminal Value | 235,054 | |||||||||
| Enterprise Value | 259,203 | |||||||||
| Net Debt | 22,528 | |||||||||
| Equity Value | 236,675 | |||||||||
| Diluted Shares Outstanding, MM | 352 | |||||||||
| Equity Value Per Share | 671.64 |
Benefits of Choosing Sarda Energy & Minerals Limited (SARDAENNS)
- Comprehensive Financial Model: Utilize Sarda Energy's actual data for accurate DCF valuation.
- Complete Forecasting Control: Modify revenue growth, margins, WACC, and other essential variables.
- Real-Time Calculations: Automatic updates guarantee immediate visibility of results with every change.
- Professional-Grade Template: A polished Excel file crafted for top-tier valuation purposes.
- Flexible and Reusable: Designed for adaptability, enabling repeated application for thorough forecasts.
Key Features
- Comprehensive SARDAENNS Data: Pre-loaded with Sarda Energy & Minerals Limited’s historical financial performance and future projections.
- Customizable Inputs: Modify revenue growth rates, profit margins, weighted average cost of capital (WACC), tax rates, and capital expenditure figures.
- Interactive Valuation Model: Automatic recalculations of Net Present Value (NPV) and intrinsic value based on your parameters.
- Scenario Analysis: Develop various forecasting scenarios to evaluate different valuation results.
- User-Centric Interface: Intuitive and organized design tailored for both experienced users and newcomers.
How It Functions
- Download the Template: Gain immediate access to the Excel-based SARDAENNS DCF Calculator.
- Input Your Assumptions: Modify the yellow-highlighted cells for growth rates, WACC, margins, and other parameters.
- Instant Calculations: The model automatically recalculates the intrinsic value of Sarda Energy & Minerals Limited.
- Test Scenarios: Experiment with various assumptions to assess potential changes in valuation.
- Analyze and Decide: Utilize the output to inform your investment or financial analysis decisions.
Why Choose This Calculator for Sarda Energy & Minerals Limited (SARDAENNS)?
- Designed for Experts: A sophisticated tool utilized by industry analysts, CFOs, and consultants.
- Reliable Data: Historical and projected financial information for Sarda Energy preloaded for precision.
- Scenario Analysis: Effortlessly test various forecasts and assumptions.
- Comprehensive Outputs: Instantly calculates intrinsic value, NPV, and essential metrics.
- User-Friendly: Step-by-step guidance ensures a smooth experience.
Who Can Benefit from Sarda Energy & Minerals Limited (SARDAENNS)?
- Investors: Gain insights and make informed decisions with our expert valuation tools.
- Financial Analysts: Streamline your workflow with our customizable financial models.
- Consultants: Effortlessly tailor our templates for client reports and presentations.
- Finance Enthusiasts: Enhance your knowledge of valuation methods through practical examples.
- Educators and Students: Utilize our resources as effective teaching aids in finance courses.
Components of the Template
- Preloaded SARDAENNS Data: Historical and projected financial metrics, including revenue, EBIT, and capital expenditures.
- DCF and WACC Models: Advanced spreadsheets for determining intrinsic value and Weighted Average Cost of Capital.
- Editable Inputs: Yellow-highlighted fields for modifying revenue growth, tax rates, and discount rates.
- Financial Statements: Detailed annual and quarterly financial reports for in-depth analysis.
- Key Ratios: Profitability, leverage, and efficiency ratios to assess performance.
- Dashboard and Charts: Visual representations of valuation results and assumptions.
Disclaimer
All information, articles, and product details provided on this website are for general informational and educational purposes only. We do not claim any ownership over, nor do we intend to infringe upon, any trademarks, copyrights, logos, brand names, or other intellectual property mentioned or depicted on this site. Such intellectual property remains the property of its respective owners, and any references here are made solely for identification or informational purposes, without implying any affiliation, endorsement, or partnership.
We make no representations or warranties, express or implied, regarding the accuracy, completeness, or suitability of any content or products presented. Nothing on this website should be construed as legal, tax, investment, financial, medical, or other professional advice. In addition, no part of this site—including articles or product references—constitutes a solicitation, recommendation, endorsement, advertisement, or offer to buy or sell any securities, franchises, or other financial instruments, particularly in jurisdictions where such activity would be unlawful.
All content is of a general nature and may not address the specific circumstances of any individual or entity. It is not a substitute for professional advice or services. Any actions you take based on the information provided here are strictly at your own risk. You accept full responsibility for any decisions or outcomes arising from your use of this website and agree to release us from any liability in connection with your use of, or reliance upon, the content or products found herein.