
|
SBI Life Insurance Company Limited (SBILIFE.NS) Évaluation DCF |
Entièrement Modifiable: Adapté À Vos Besoins Dans Excel Ou Sheets
Conception Professionnelle: Modèles Fiables Et Conformes Aux Normes Du Secteur
Pré-Construits Pour Une Utilisation Rapide Et Efficace
Compatible MAC/PC, entièrement débloqué
Aucune Expertise N'Est Requise; Facile À Suivre
SBI Life Insurance Company Limited (SBILIFE.NS) Bundle
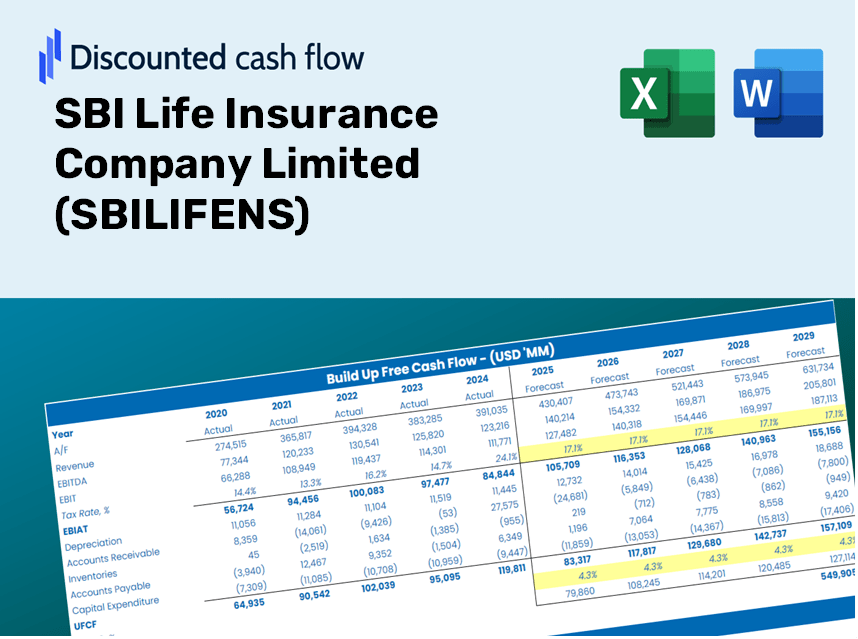
Améliorez vos stratégies d'investissement avec la calculatrice DCF (SBILIFENS)! Explorez de véritables données financières de la SBI Life Insurance Company, ajustez les prédictions et les dépenses de croissance et observez instantanément les effets sur la valeur intrinsèque (SBILIFENS).
Discounted Cash Flow (DCF) - (USD MM)
| Year | AY1 2021 |
AY2 2022 |
AY3 2023 |
AY4 2024 |
AY5 2025 |
FY1 2026 |
FY2 2027 |
FY3 2028 |
FY4 2029 |
FY5 2030 |
|---|---|---|---|---|---|---|---|---|---|---|
| Revenue | 821,216.8 | 829,112.4 | 806,390.4 | 1,309,255.6 | 1,154,124.5 | 1,294,731.9 | 1,452,469.6 | 1,629,424.5 | 1,827,937.9 | 2,050,636.2 |
| Revenue Growth, % | 0 | 0.96145 | -2.74 | 62.36 | -11.85 | 12.18 | 12.18 | 12.18 | 12.18 | 12.18 |
| EBITDA | 16,632.3 | 16,576.4 | 18,510.7 | 20,274.7 | 25,898.6 | 26,186.5 | 29,376.8 | 32,955.8 | 36,970.8 | 41,474.9 |
| EBITDA, % | 2.03 | 2 | 2.3 | 1.55 | 2.24 | 2.02 | 2.02 | 2.02 | 2.02 | 2.02 |
| Depreciation | 994.0 | 749.0 | 677.9 | 762.3 | 837.5 | 1,103.7 | 1,238.2 | 1,389.0 | 1,558.2 | 1,748.1 |
| Depreciation, % | 0.12104 | 0.09033287 | 0.08406722 | 0.05822393 | 0.07256583 | 0.08524546 | 0.08524546 | 0.08524546 | 0.08524546 | 0.08524546 |
| EBIT | 15,638.3 | 15,827.5 | 17,832.8 | 19,512.4 | 25,061.1 | 25,082.8 | 28,138.6 | 31,566.8 | 35,412.5 | 39,726.9 |
| EBIT, % | 1.9 | 1.91 | 2.21 | 1.49 | 2.17 | 1.94 | 1.94 | 1.94 | 1.94 | 1.94 |
| Total Cash | 15,420.5 | 26,852.7 | 23,434.2 | 48,309.9 | 18,466.3 | 34,472.1 | 38,671.9 | 43,383.3 | 48,668.7 | 54,598.0 |
| Total Cash, percent | .0 | .0 | .0 | .0 | .0 | .0 | .0 | .0 | .0 | .0 |
| Account Receivables | .0 | 35,144.2 | 41,778.1 | 54,589.1 | 49,390.0 | 46,270.0 | 51,907.1 | 58,231.0 | 65,325.3 | 73,283.9 |
| Account Receivables, % | 0 | 4.24 | 5.18 | 4.17 | 4.28 | 3.57 | 3.57 | 3.57 | 3.57 | 3.57 |
| Inventories | .0 | .0 | .0 | .0 | .0 | .0 | .0 | .0 | .0 | .0 |
| Inventories, % | 0 | 0 | 0 | 0 | 0 | 0 | 0 | 0 | 0 | 0 |
| Accounts Payable | 14,518.3 | 17,837.3 | 22,123.9 | 27,225.5 | 31,347.5 | 29,671.2 | 33,286.1 | 37,341.3 | 41,890.7 | 46,994.2 |
| Accounts Payable, % | 1.77 | 2.15 | 2.74 | 2.08 | 2.72 | 2.29 | 2.29 | 2.29 | 2.29 | 2.29 |
| Capital Expenditure | -1,045.2 | -557.9 | -632.0 | -1,143.9 | -1,061.9 | -1,171.3 | -1,313.9 | -1,474.0 | -1,653.6 | -1,855.1 |
| Capital Expenditure, % | -0.12728 | -0.06728545 | -0.07837581 | -0.08736995 | -0.09200914 | -0.09046315 | -0.09046315 | -0.09046315 | -0.09046315 | -0.09046315 |
| Tax Rate, % | 3.26 | 3.26 | 3.26 | 3.26 | 3.26 | 3.26 | 3.26 | 3.26 | 3.26 | 3.26 |
| EBITAT | 14,760.2 | 15,272.2 | 17,448.7 | 19,026.8 | 24,243.7 | 24,228.6 | 27,180.3 | 30,491.7 | 34,206.6 | 38,374.0 |
| Depreciation | ||||||||||
| Changes in Account Receivables | ||||||||||
| Changes in Inventories | ||||||||||
| Changes in Accounts Payable | ||||||||||
| Capital Expenditure | ||||||||||
| UFCF | 29,227.3 | -16,361.9 | 15,147.3 | 10,935.9 | 33,340.4 | 25,604.7 | 25,082.3 | 28,138.1 | 31,566.2 | 35,411.9 |
| WACC, % | 5.42 | 5.42 | 5.42 | 5.42 | 5.42 | 5.42 | 5.42 | 5.42 | 5.42 | 5.42 |
| PV UFCF | ||||||||||
| SUM PV UFCF | 123,630.1 | |||||||||
| Long Term Growth Rate, % | 2.00 | |||||||||
| Free cash flow (T + 1) | 36,120 | |||||||||
| Terminal Value | 1,056,046 | |||||||||
| Present Terminal Value | 811,075 | |||||||||
| Enterprise Value | 934,705 | |||||||||
| Net Debt | -18,466 | |||||||||
| Equity Value | 953,172 | |||||||||
| Diluted Shares Outstanding, MM | 1,003 | |||||||||
| Equity Value Per Share | 950.68 |
What You Will Receive
- Comprehensive SBILIFENS Financials: Access both historical and projected data for precise valuation.
- Customizable Parameters: Adjust key inputs like WACC, tax rates, premium growth, and capital investments.
- Real-Time Calculations: Dynamic computation of intrinsic value and NPV.
- Scenario Analysis: Explore various scenarios to assess SBI Life's future performance.
- User-Friendly Interface: Designed for professionals while remaining approachable for novices.
Key Features
- 🔍 Real-Life SBILIFENS Financials: Pre-filled historical and projected data for SBI Life Insurance Company Limited.
- ✏️ Fully Customizable Inputs: Adjust all critical parameters (yellow cells) including WACC, growth %, and tax rates.
- 📊 Professional DCF Valuation: Integrated formulas that compute the intrinsic value of SBI Life Insurance using the Discounted Cash Flow method.
- ⚡ Instant Results: Get immediate visual feedback on SBI Life's valuation after making adjustments.
- Scenario Analysis: Evaluate and contrast different financial outcomes based on various assumptions side-by-side.
How It Functions
- Step 1: Download the Excel file.
- Step 2: Examine SBI Life Insurance Company's (SBILIFENS) pre-filled financial data and projections.
- Step 3: Adjust key inputs such as premium growth, discount rates, and mortality assumptions (highlighted cells).
- Step 4: Observe the DCF model refresh instantly as you make adjustments.
- Step 5: Evaluate the results and utilize the findings for investment strategies.
Why Choose This Calculator for SBI Life Insurance Company Limited (SBILIFENS)?
- Designed for Experts: A sophisticated tool utilized by financial analysts, actuaries, and insurance consultants.
- Accurate Data: SBILIFENS’ historical and projected financial information pre-loaded for precision.
- Scenario Analysis: Effortlessly model various forecasts and assumptions.
- Insightful Results: Automatically computes intrinsic value, NPV, and essential metrics.
- User-Friendly: Comprehensive step-by-step instructions to navigate the tool with ease.
Who Should Utilize This Insurance Product?
- Individual Policyholders: Make educated choices regarding your life insurance coverage with SBI Life Insurance Company Limited (SBILIFENS).
- Insurance Analysts: Enhance assessment workflows with readily available actuarial models and insights.
- Financial Consultants: Provide comprehensive insurance solutions and evaluations to clients promptly and accurately.
- Business Owners: Gain insights into how large insurance firms like SBI Life are appraised to inform your business strategy.
- Finance Students: Explore insurance valuation methods utilizing real-life data and case studies.
What the Template Includes
- Pre-Filled Data: Contains SBI Life Insurance's historical financials and forecasts.
- Discounted Cash Flow Model: Editable DCF valuation model featuring automatic calculations.
- Weighted Average Cost of Capital (WACC): A specific sheet for calculating WACC with user-defined inputs.
- Key Financial Ratios: Evaluate SBI Life Insurance's profitability, efficiency, and leverage metrics.
- Customizable Inputs: Easily modify revenue growth, margins, and tax rates.
- Clear Dashboard: Visual summaries including charts and tables that highlight key valuation results.
Disclaimer
All information, articles, and product details provided on this website are for general informational and educational purposes only. We do not claim any ownership over, nor do we intend to infringe upon, any trademarks, copyrights, logos, brand names, or other intellectual property mentioned or depicted on this site. Such intellectual property remains the property of its respective owners, and any references here are made solely for identification or informational purposes, without implying any affiliation, endorsement, or partnership.
We make no representations or warranties, express or implied, regarding the accuracy, completeness, or suitability of any content or products presented. Nothing on this website should be construed as legal, tax, investment, financial, medical, or other professional advice. In addition, no part of this site—including articles or product references—constitutes a solicitation, recommendation, endorsement, advertisement, or offer to buy or sell any securities, franchises, or other financial instruments, particularly in jurisdictions where such activity would be unlawful.
All content is of a general nature and may not address the specific circumstances of any individual or entity. It is not a substitute for professional advice or services. Any actions you take based on the information provided here are strictly at your own risk. You accept full responsibility for any decisions or outcomes arising from your use of this website and agree to release us from any liability in connection with your use of, or reliance upon, the content or products found herein.