
|
SES S.A. (SESG.PA) Évaluation DCF |
Entièrement Modifiable: Adapté À Vos Besoins Dans Excel Ou Sheets
Conception Professionnelle: Modèles Fiables Et Conformes Aux Normes Du Secteur
Pré-Construits Pour Une Utilisation Rapide Et Efficace
Compatible MAC/PC, entièrement débloqué
Aucune Expertise N'Est Requise; Facile À Suivre
SES S.A. (SESG.PA) Bundle
Améliorez vos choix d'investissement avec la calculatrice DCF SES S.A. (SESGPA)! Explorez les relations financières réelles pour SES S.A., ajustez les prédictions et les dépenses de croissance et observez comment ces modifications affectent la valeur intrinsèque SES S.A. (SESGPA) en temps réel.
What You Will Receive
- Adjustable Forecast Parameters: Effortlessly modify key assumptions (growth %, profit margins, WACC) to develop various scenarios.
- Comprehensive Data: SES S.A.'s (SESGPA) financial information pre-loaded to facilitate your analysis.
- Instant DCF Calculations: The template automatically computes Net Present Value (NPV) and intrinsic value for you.
- Tailored and Professional Design: A sleek Excel model that can be customized to fit your valuation requirements.
- Designed for Analysts and Investors: Perfect for examining projections, assessing strategies, and optimizing your time.
Key Features
- 🔍 Real-Life SES S.A. Financials: Pre-filled historical and projected data for SES S.A. (SESGPA).
- ✏️ Fully Customizable Inputs: Modify all essential parameters (yellow cells) such as WACC, growth %, and tax rates.
- 📊 Professional DCF Valuation: Integrated formulas calculate the intrinsic value of SES S.A. (SESGPA) using the Discounted Cash Flow methodology.
- ⚡ Instant Results: Visualize the valuation of SES S.A. (SESGPA) immediately after making adjustments.
- Scenario Analysis: Evaluate and compare results for different financial assumptions side-by-side.
How It Operates
- Step 1: Download the ready-to-use Excel template containing SES S.A.'s data.
- Step 2: Navigate through the pre-filled sheets to familiarize yourself with the essential metrics.
- Step 3: Revise forecasts and assumptions in the editable yellow cells (WACC, growth rates, margins).
- Step 4: Immediately see the updated results, including SES S.A.'s intrinsic value.
- Step 5: Make well-informed investment choices or prepare reports based on the results.
Why Opt for SES S.A. (SESGPA)?
- User-Friendly Interface: Built to cater to both novices and seasoned professionals.
- Customizable Parameters: Flexibly adjust inputs to suit your analytical needs.
- Real-Time Updates: Observe immediate changes in SES S.A.'s valuation as you tweak the inputs.
- Pre-Configured Setup: Instantly accessible with SES S.A.'s up-to-date financial statistics for effortless analysis.
- Endorsed by Experts: Preferred by investors and analysts for making well-informed choices.
Who Can Benefit from SES S.A. (SESGPA)?
- Individual Investors: Make informed choices about purchasing or selling SES S.A. (SESGPA) shares.
- Financial Analysts: Enhance valuation assessments with ready-to-use financial models tailored for SES S.A. (SESGPA).
- Consultants: Provide clients with accurate and timely valuation insights regarding SES S.A. (SESGPA).
- Business Owners: Gain a clearer understanding of how large corporations like SES S.A. (SESGPA) are valued to inform your strategic planning.
- Finance Students: Explore valuation methods using real-world data and case studies related to SES S.A. (SESGPA).
Contents of the Template
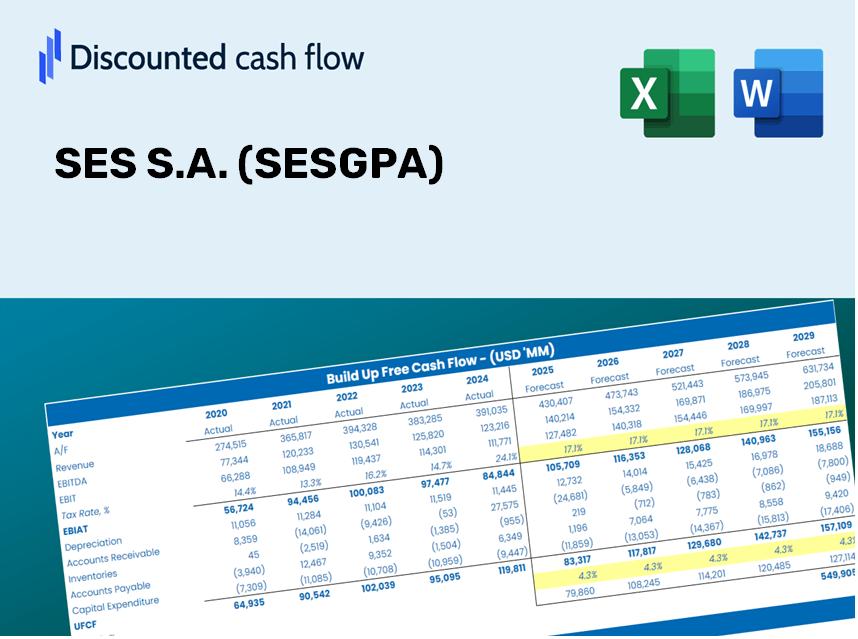
- Operating and Balance Sheet Data: Pre-filled historical data and forecasts for SES S.A. (SESGPA), including figures for revenue, EBITDA, EBIT, and capital expenditures.
- WACC Calculation: A specialized sheet for calculating Weighted Average Cost of Capital (WACC), featuring inputs such as Beta, risk-free rate, and share price.
- DCF Valuation (Unlevered and Levered): Customizable Discounted Cash Flow models that provide estimates of intrinsic value with comprehensive calculations.
- Financial Statements: Pre-loaded financial statements (both annual and quarterly) to facilitate detailed analysis.
- Key Ratios: Includes important profitability, leverage, and efficiency ratios specific to SES S.A. (SESGPA).
- Dashboard and Charts: Visual representation of valuation outputs and assumptions for straightforward analysis of results.
Disclaimer
All information, articles, and product details provided on this website are for general informational and educational purposes only. We do not claim any ownership over, nor do we intend to infringe upon, any trademarks, copyrights, logos, brand names, or other intellectual property mentioned or depicted on this site. Such intellectual property remains the property of its respective owners, and any references here are made solely for identification or informational purposes, without implying any affiliation, endorsement, or partnership.
We make no representations or warranties, express or implied, regarding the accuracy, completeness, or suitability of any content or products presented. Nothing on this website should be construed as legal, tax, investment, financial, medical, or other professional advice. In addition, no part of this site—including articles or product references—constitutes a solicitation, recommendation, endorsement, advertisement, or offer to buy or sell any securities, franchises, or other financial instruments, particularly in jurisdictions where such activity would be unlawful.
All content is of a general nature and may not address the specific circumstances of any individual or entity. It is not a substitute for professional advice or services. Any actions you take based on the information provided here are strictly at your own risk. You accept full responsibility for any decisions or outcomes arising from your use of this website and agree to release us from any liability in connection with your use of, or reliance upon, the content or products found herein.