
|
Shaily Engineering Plastics Limited (Shaily.NS) Évaluation DCF |
Entièrement Modifiable: Adapté À Vos Besoins Dans Excel Ou Sheets
Conception Professionnelle: Modèles Fiables Et Conformes Aux Normes Du Secteur
Pré-Construits Pour Une Utilisation Rapide Et Efficace
Compatible MAC/PC, entièrement débloqué
Aucune Expertise N'Est Requise; Facile À Suivre
Shaily Engineering Plastics Limited (SHAILY.NS) Bundle
Conçu pour la précision, notre calculatrice (Shailyns) DCF vous permet d'évaluer l'évaluation de Shaily Engineering Plastics Limited en utilisant des données financières du monde réel, ainsi qu'une flexibilité complète pour modifier tous les paramètres essentiels pour des projections améliorées.
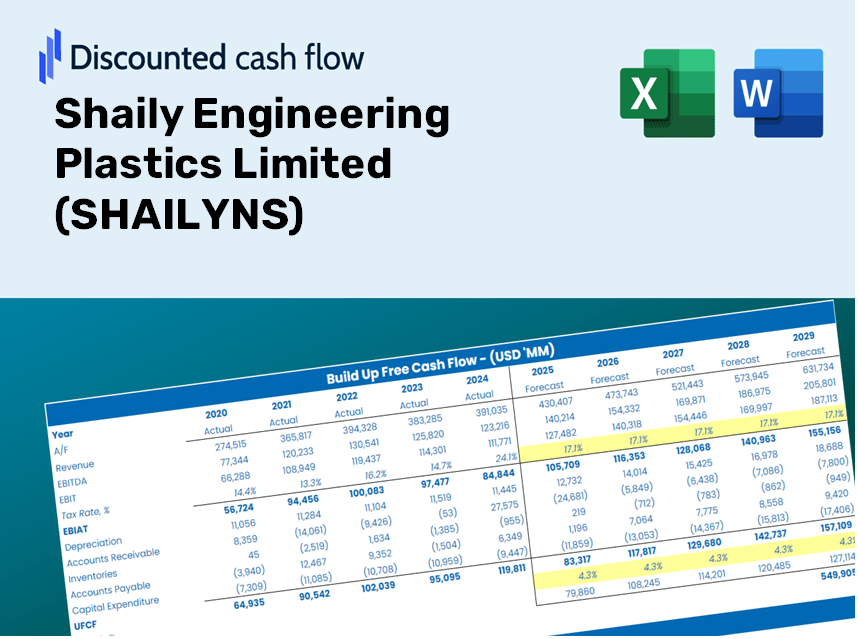
Discounted Cash Flow (DCF) - (USD MM)
| Year | AY1 2021 |
AY2 2022 |
AY3 2023 |
AY4 2024 |
AY5 2025 |
FY1 2026 |
FY2 2027 |
FY3 2028 |
FY4 2029 |
FY5 2030 |
|---|---|---|---|---|---|---|---|---|---|---|
| Revenue | 3,606.0 | 5,677.1 | 6,070.7 | 6,438.7 | 7,868.0 | 9,690.0 | 11,933.9 | 14,697.5 | 18,101.1 | 22,292.8 |
| Revenue Growth, % | 0 | 57.44 | 6.93 | 6.06 | 22.2 | 23.16 | 23.16 | 23.16 | 23.16 | 23.16 |
| EBITDA | 594.1 | 799.0 | 936.7 | 1,160.5 | 1,753.7 | 1,672.3 | 2,059.6 | 2,536.5 | 3,123.9 | 3,847.3 |
| EBITDA, % | 16.47 | 14.07 | 15.43 | 18.02 | 22.29 | 17.26 | 17.26 | 17.26 | 17.26 | 17.26 |
| Depreciation | 193.8 | 252.4 | 321.0 | 348.0 | 414.6 | 499.7 | 615.4 | 757.9 | 933.4 | 1,149.5 |
| Depreciation, % | 5.37 | 4.45 | 5.29 | 5.4 | 5.27 | 5.16 | 5.16 | 5.16 | 5.16 | 5.16 |
| EBIT | 400.3 | 546.5 | 615.7 | 812.5 | 1,339.0 | 1,172.6 | 1,444.2 | 1,778.6 | 2,190.5 | 2,697.8 |
| EBIT, % | 11.1 | 9.63 | 10.14 | 12.62 | 17.02 | 12.1 | 12.1 | 12.1 | 12.1 | 12.1 |
| Total Cash | 9.8 | 431.5 | 275.2 | 222.2 | 231.4 | 364.3 | 448.7 | 552.6 | 680.5 | 838.1 |
| Total Cash, percent | .0 | .0 | .0 | .0 | .0 | .0 | .0 | .0 | .0 | .0 |
| Account Receivables | 747.4 | 1,091.7 | 999.3 | 1,186.1 | 1,720.7 | 1,874.2 | 2,308.3 | 2,842.8 | 3,501.1 | 4,311.9 |
| Account Receivables, % | 20.73 | 19.23 | 16.46 | 18.42 | 21.87 | 19.34 | 19.34 | 19.34 | 19.34 | 19.34 |
| Inventories | 668.7 | 1,114.3 | 729.7 | 836.0 | 1,377.6 | 1,563.7 | 1,925.8 | 2,371.7 | 2,921.0 | 3,597.4 |
| Inventories, % | 18.54 | 19.63 | 12.02 | 12.98 | 17.51 | 16.14 | 16.14 | 16.14 | 16.14 | 16.14 |
| Accounts Payable | 384.8 | 855.6 | 534.0 | 686.6 | 990.3 | 1,120.0 | 1,379.3 | 1,698.7 | 2,092.1 | 2,576.6 |
| Accounts Payable, % | 10.67 | 15.07 | 8.8 | 10.66 | 12.59 | 11.56 | 11.56 | 11.56 | 11.56 | 11.56 |
| Capital Expenditure | -830.3 | -1,207.8 | -1,116.4 | -870.4 | -680.2 | -1,644.5 | -2,025.3 | -2,494.3 | -3,071.9 | -3,783.3 |
| Capital Expenditure, % | -23.03 | -21.28 | -18.39 | -13.52 | -8.64 | -16.97 | -16.97 | -16.97 | -16.97 | -16.97 |
| Tax Rate, % | 21.93 | 21.93 | 21.93 | 21.93 | 21.93 | 21.93 | 21.93 | 21.93 | 21.93 | 21.93 |
| EBITAT | 295.0 | 414.2 | 478.7 | 666.4 | 1,045.4 | 908.4 | 1,118.7 | 1,377.8 | 1,696.9 | 2,089.8 |
| Depreciation | ||||||||||
| Changes in Account Receivables | ||||||||||
| Changes in Inventories | ||||||||||
| Changes in Accounts Payable | ||||||||||
| Capital Expenditure | ||||||||||
| UFCF | -1,372.9 | -860.3 | -161.3 | 3.6 | 7.5 | -446.5 | -828.0 | -1,019.7 | -1,255.8 | -1,546.7 |
| WACC, % | 4.58 | 4.58 | 4.58 | 4.59 | 4.58 | 4.58 | 4.58 | 4.58 | 4.58 | 4.58 |
| PV UFCF | ||||||||||
| SUM PV UFCF | -4,361.6 | |||||||||
| Long Term Growth Rate, % | 4.00 | |||||||||
| Free cash flow (T + 1) | -1,609 | |||||||||
| Terminal Value | -276,737 | |||||||||
| Present Terminal Value | -221,207 | |||||||||
| Enterprise Value | -225,568 | |||||||||
| Net Debt | 1,651 | |||||||||
| Equity Value | -227,219 | |||||||||
| Diluted Shares Outstanding, MM | 46 | |||||||||
| Equity Value Per Share | -4,936.02 |
What You Will Receive
- Authentic SHAILYNS Data: Comprehensive financial information – from revenue to EBIT – based on actual and forecasted metrics.
- Complete Customization: Modify all key parameters (yellow cells) such as WACC, growth %, and tax rates.
- Instant Valuation Revisions: Automatic updates to evaluate the effects of changes on SHAILYNS’s fair value.
- Flexible Excel Template: Designed for seamless edits, scenario analysis, and in-depth projections.
- Efficient and Precise: Avoid building models from the ground up while ensuring accuracy and adaptability.
Key Features
- Pre-Loaded Data: Shaily Engineering Plastics Limited’s historical financial statements and pre-filled forecasts.
- Fully Adjustable Inputs: Modify WACC, tax rates, revenue growth, and EBITDA margins as needed.
- Instant Results: Observe Shaily Engineering Plastics Limited’s intrinsic value recalculating in real time.
- Clear Visual Outputs: Dashboard charts illustrate valuation results and essential metrics.
- Built for Accuracy: A professional tool tailored for analysts, investors, and finance specialists.
How It Operates
- Step 1: Download the Excel spreadsheet.
- Step 2: Examine Shaily Engineering Plastics Limited’s pre-populated financial metrics and projections.
- Step 3: Adjust key inputs such as revenue growth, WACC, and tax rates (highlighted cells).
- Step 4: Observe the DCF model refresh in real time as you modify your assumptions.
- Step 5: Evaluate the results and apply the findings to your investment strategies.
Why Choose This Calculator for Shaily Engineering Plastics Limited (SHAILYNS)?
- Precise Information: Utilize real financial data from Shaily Engineering Plastics for trustworthy valuation outcomes.
- Tailorable: Modify essential factors like growth rates, WACC, and tax assumptions to suit your forecasts.
- Efficient: Built-in calculations save you the hassle of starting your analysis from the ground up.
- Expert-Level Tool: Crafted specifically for investors, analysts, and business consultants.
- Easy to Use: A clear layout and detailed guidance ensure accessibility for all users.
Who Can Benefit from This Product?
- Investors: Accurately assess the fair value of Shaily Engineering Plastics Limited (SHAILYNS) before making investment choices.
- CFOs: Utilize a professional-grade DCF model for financial reporting and analysis specific to SHAILYNS.
- Consultants: Efficiently customize the template for valuation reports tailored to clients interested in SHAILYNS.
- Entrepreneurs: Discover financial modeling techniques employed by leading companies, including insights relevant to SHAILYNS.
- Educators: Implement this tool in the classroom to illustrate various valuation methodologies related to SHAILYNS.
Contents of the Template
- Detailed DCF Model: An editable template featuring in-depth valuation calculations.
- Actual Data: Historical and projected financials of Shaily Engineering Plastics Limited (SHAILYNS) are preloaded for analysis.
- Adjustable Variables: Modify WACC, growth rates, and tax assumptions to explore different scenarios.
- Comprehensive Financial Statements: Complete annual and quarterly breakdowns for enhanced insights.
- Essential Ratios: Integrated analysis for assessing profitability, efficiency, and leverage.
- Visual Dashboard: Charts and tables providing clear and actionable results.
Disclaimer
All information, articles, and product details provided on this website are for general informational and educational purposes only. We do not claim any ownership over, nor do we intend to infringe upon, any trademarks, copyrights, logos, brand names, or other intellectual property mentioned or depicted on this site. Such intellectual property remains the property of its respective owners, and any references here are made solely for identification or informational purposes, without implying any affiliation, endorsement, or partnership.
We make no representations or warranties, express or implied, regarding the accuracy, completeness, or suitability of any content or products presented. Nothing on this website should be construed as legal, tax, investment, financial, medical, or other professional advice. In addition, no part of this site—including articles or product references—constitutes a solicitation, recommendation, endorsement, advertisement, or offer to buy or sell any securities, franchises, or other financial instruments, particularly in jurisdictions where such activity would be unlawful.
All content is of a general nature and may not address the specific circumstances of any individual or entity. It is not a substitute for professional advice or services. Any actions you take based on the information provided here are strictly at your own risk. You accept full responsibility for any decisions or outcomes arising from your use of this website and agree to release us from any liability in connection with your use of, or reliance upon, the content or products found herein.