
|
Les acheteurs Stop Limited (shopersop.NS) Valation DCF |
Entièrement Modifiable: Adapté À Vos Besoins Dans Excel Ou Sheets
Conception Professionnelle: Modèles Fiables Et Conformes Aux Normes Du Secteur
Pré-Construits Pour Une Utilisation Rapide Et Efficace
Compatible MAC/PC, entièrement débloqué
Aucune Expertise N'Est Requise; Facile À Suivre
Shoppers Stop Limited (SHOPERSTOP.NS) Bundle
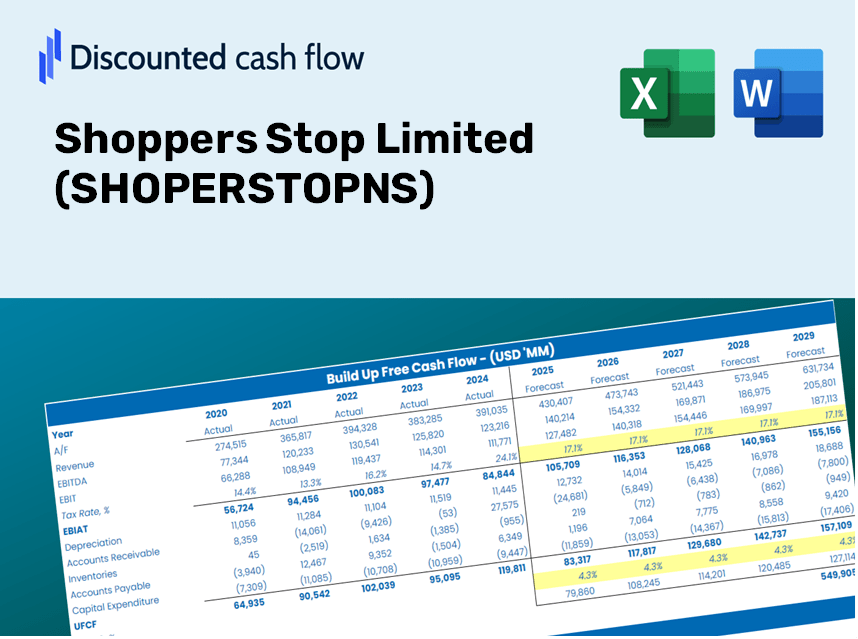
Optimisez vos choix d'investissement avec la calculatrice DCF (ShopStopns)! Examiner les acheteurs authentiques arrêtent les données financières limitées, ajustez les projections et les dépenses de croissance et observez instantanément comment ces modifications influencent la valeur intrinsèque de (ShopStopns).
What You Will Receive
- Authentic Shoppers Stop Data: Preloaded financials – covering everything from revenue to EBIT – based on actual and projected figures.
- Comprehensive Customization: Modify all key parameters (yellow cells) such as WACC, growth %, and tax rates.
- Instant Valuation Adjustments: Automatic recalculations to swiftly assess the effects of changes on Shoppers Stop's fair value.
- Flexible Excel Template: Designed for quick modifications, scenario analysis, and in-depth projections.
- Efficient and Precise: Avoid the hassle of building models from the ground up while ensuring accuracy and adaptability.
Key Features
- 🔍 Real-Life SHOPERSTOPNS Financials: Pre-filled historical and projected data for Shoppers Stop Limited.
- ✏️ Fully Customizable Inputs: Adjust all critical parameters (yellow cells) such as WACC, growth %, and tax rates.
- 📊 Professional DCF Valuation: Integrated formulas calculate Shoppers Stop's intrinsic value using the Discounted Cash Flow method.
- ⚡ Instant Results: Visualize Shoppers Stop's valuation immediately after making adjustments.
- Scenario Analysis: Evaluate and compare outcomes for various financial assumptions side-by-side.
How It Works
- Step 1: Download the Excel file for Shoppers Stop Limited (SHOPERSTOPNS).
- Step 2: Examine the pre-filled financial data and forecasts for Shoppers Stop.
- Step 3: Adjust key inputs such as revenue growth, WACC, and tax rates (highlighted cells) to fit your analysis.
- Step 4: Observe the DCF model refresh in real-time as you make changes to your assumptions.
- Step 5: Review the results and leverage the insights for your investment strategies.
Why Opt for This Calculator?
- All-in-One Solution: Incorporates DCF, WACC, and various financial ratio analyses seamlessly.
- Flexible Inputs: Modify the yellow-highlighted cells to explore different scenarios.
- In-Depth Analysis: Automatically computes Shoppers Stop Limited's intrinsic value and Net Present Value.
- Built-In Data: Access historical and projected data for precise starting points.
- Expert Level: Perfect for financial analysts, investors, and business consultants.
Who Should Use Shoppers Stop Limited (SHOPERSTOPNS)?
- Individual Investors: Make informed decisions about buying or selling shares in Shoppers Stop Limited.
- Financial Analysts: Enhance valuation processes with accessible financial models tailored for Shoppers Stop Limited.
- Consultants: Provide clients with timely and accurate valuation insights regarding Shoppers Stop Limited.
- Business Owners: Gain a deeper understanding of how major retail companies like Shoppers Stop Limited are valued to inform your strategic planning.
- Finance Students: Explore valuation methodologies using real data and case studies relevant to Shoppers Stop Limited.
Contents of the Template
- Comprehensive DCF Model: Interactive template featuring detailed valuation calculations.
- Real-World Data: Shoppers Stop Limited’s historical and projected financials preloaded for analysis.
- Customizable Parameters: Modify WACC, growth rates, and tax assumptions to explore various scenarios.
- Financial Statements: Complete annual and quarterly breakdowns for in-depth insights.
- Key Ratios: Integrated analysis of profitability, efficiency, and leverage metrics.
- Dashboard with Visual Outputs: Charts and tables presenting clear, actionable results.
Disclaimer
All information, articles, and product details provided on this website are for general informational and educational purposes only. We do not claim any ownership over, nor do we intend to infringe upon, any trademarks, copyrights, logos, brand names, or other intellectual property mentioned or depicted on this site. Such intellectual property remains the property of its respective owners, and any references here are made solely for identification or informational purposes, without implying any affiliation, endorsement, or partnership.
We make no representations or warranties, express or implied, regarding the accuracy, completeness, or suitability of any content or products presented. Nothing on this website should be construed as legal, tax, investment, financial, medical, or other professional advice. In addition, no part of this site—including articles or product references—constitutes a solicitation, recommendation, endorsement, advertisement, or offer to buy or sell any securities, franchises, or other financial instruments, particularly in jurisdictions where such activity would be unlawful.
All content is of a general nature and may not address the specific circumstances of any individual or entity. It is not a substitute for professional advice or services. Any actions you take based on the information provided here are strictly at your own risk. You accept full responsibility for any decisions or outcomes arising from your use of this website and agree to release us from any liability in connection with your use of, or reliance upon, the content or products found herein.