
|
SIVÉE CORPORATION (SITM) Évaluation DCF |
Entièrement Modifiable: Adapté À Vos Besoins Dans Excel Ou Sheets
Conception Professionnelle: Modèles Fiables Et Conformes Aux Normes Du Secteur
Pré-Construits Pour Une Utilisation Rapide Et Efficace
Compatible MAC/PC, entièrement débloqué
Aucune Expertise N'Est Requise; Facile À Suivre
SiTime Corporation (SITM) Bundle
Conçu pour la précision, notre calculatrice DCF (SITM) vous permet d'évaluer l'évaluation de Sittime Corporation à l'aide de données financières réelles, offrant une flexibilité complète pour modifier tous les paramètres essentiels pour des projections améliorées.
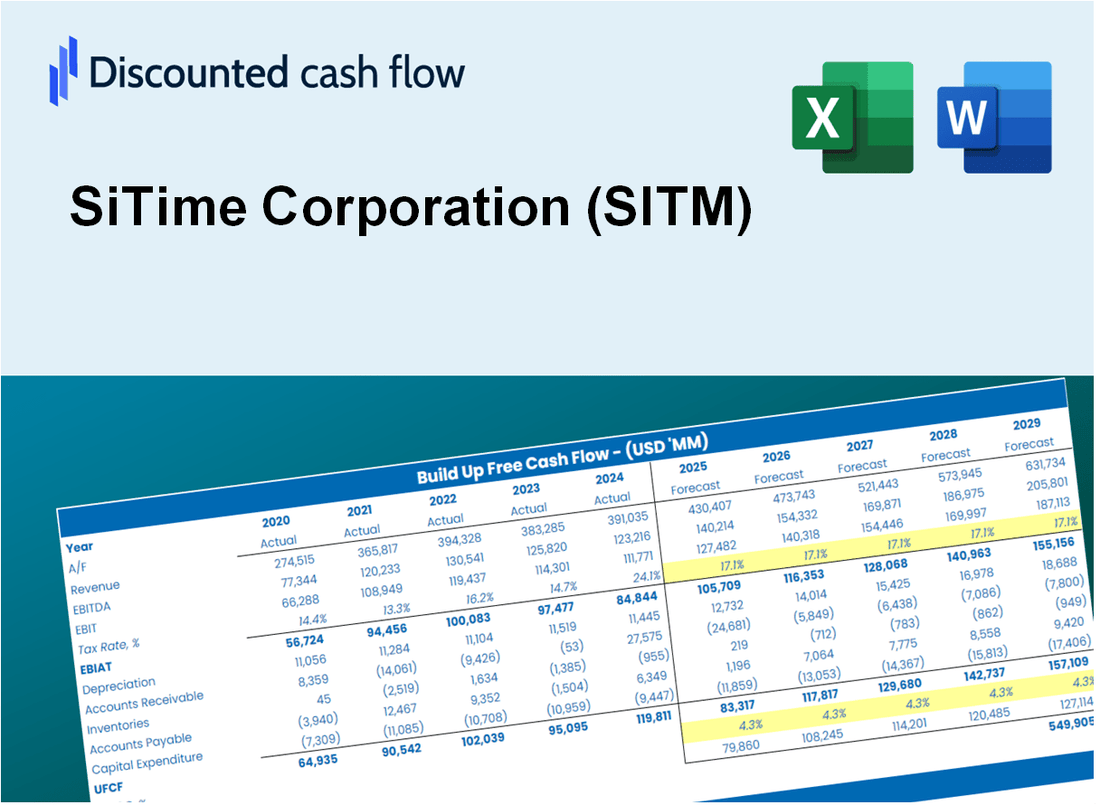
Discounted Cash Flow (DCF) - (USD MM)
| Year | AY1 2020 |
AY2 2021 |
AY3 2022 |
AY4 2023 |
AY5 2024 |
FY1 2025 |
FY2 2026 |
FY3 2027 |
FY4 2028 |
FY5 2029 |
|---|---|---|---|---|---|---|---|---|---|---|
| Revenue | 116.2 | 218.8 | 283.6 | 144.0 | 202.7 | 258.2 | 328.9 | 419.0 | 533.7 | 679.8 |
| Revenue Growth, % | 0 | 88.37 | 29.61 | -49.23 | 40.77 | 27.38 | 27.38 | 27.38 | 27.38 | 27.38 |
| EBITDA | -2.2 | 40.8 | 28.0 | -83.3 | -74.4 | -35.1 | -44.7 | -57.0 | -72.6 | -92.5 |
| EBITDA, % | -1.9 | 18.63 | 9.87 | -57.88 | -36.73 | -13.6 | -13.6 | -13.6 | -13.6 | -13.6 |
| Depreciation | 6.4 | 7.9 | 11.8 | 16.1 | 30.1 | 20.3 | 25.9 | 33.0 | 42.0 | 53.5 |
| Depreciation, % | 5.51 | 3.62 | 4.18 | 11.2 | 14.84 | 7.87 | 7.87 | 7.87 | 7.87 | 7.87 |
| EBIT | -8.6 | 32.8 | 16.1 | -99.5 | -104.5 | -55.4 | -70.6 | -90.0 | -114.6 | -146.0 |
| EBIT, % | -7.42 | 15.01 | 5.69 | -69.08 | -51.56 | -21.47 | -21.47 | -21.47 | -21.47 | -21.47 |
| Total Cash | 73.5 | 559.5 | 564.1 | 528.2 | 418.8 | 239.2 | 304.8 | 388.2 | 494.5 | 629.9 |
| Total Cash, percent | .0 | .0 | .0 | .0 | .0 | .0 | .0 | .0 | .0 | .0 |
| Account Receivables | 24.7 | 38.4 | 41.2 | 21.9 | 38.2 | 45.1 | 57.4 | 73.2 | 93.2 | 118.7 |
| Account Receivables, % | 21.23 | 17.54 | 14.54 | 15.18 | 18.85 | 17.47 | 17.47 | 17.47 | 17.47 | 17.47 |
| Inventories | 12.4 | 23.6 | 57.7 | 65.5 | 76.7 | 64.6 | 82.3 | 104.9 | 133.6 | 170.1 |
| Inventories, % | 10.63 | 10.8 | 20.33 | 45.52 | 37.86 | 25.03 | 25.03 | 25.03 | 25.03 | 25.03 |
| Accounts Payable | 6.2 | 13.1 | 14.9 | 8.7 | 22.9 | 17.5 | 22.3 | 28.4 | 36.2 | 46.1 |
| Accounts Payable, % | 5.32 | 5.99 | 5.25 | 6.04 | 11.29 | 6.78 | 6.78 | 6.78 | 6.78 | 6.78 |
| Capital Expenditure | -7.8 | -33.8 | -35.6 | -12.2 | -36.2 | -31.5 | -40.2 | -51.2 | -65.2 | -83.1 |
| Capital Expenditure, % | -6.71 | -15.44 | -12.57 | -8.51 | -17.87 | -12.22 | -12.22 | -12.22 | -12.22 | -12.22 |
| Tax Rate, % | -0.52194 | -0.52194 | -0.52194 | -0.52194 | -0.52194 | -0.52194 | -0.52194 | -0.52194 | -0.52194 | -0.52194 |
| EBITAT | -8.6 | 32.8 | 16.1 | -99.7 | -105.1 | -55.4 | -70.5 | -89.9 | -114.5 | -145.8 |
| Depreciation | ||||||||||
| Changes in Account Receivables | ||||||||||
| Changes in Inventories | ||||||||||
| Changes in Accounts Payable | ||||||||||
| Capital Expenditure | ||||||||||
| UFCF | -40.8 | -11.2 | -42.8 | -90.5 | -124.6 | -66.8 | -110.1 | -140.2 | -178.6 | -227.6 |
| WACC, % | 15.76 | 15.76 | 15.76 | 15.76 | 15.76 | 15.76 | 15.76 | 15.76 | 15.76 | 15.76 |
| PV UFCF | ||||||||||
| SUM PV UFCF | -439.1 | |||||||||
| Long Term Growth Rate, % | 4.00 | |||||||||
| Free cash flow (T + 1) | -237 | |||||||||
| Terminal Value | -2,012 | |||||||||
| Present Terminal Value | -968 | |||||||||
| Enterprise Value | -1,407 | |||||||||
| Net Debt | 0 | |||||||||
| Equity Value | -1,407 | |||||||||
| Diluted Shares Outstanding, MM | 23 | |||||||||
| Equity Value Per Share | -60.85 |
What You Will Get
- Real SITM Financials: Access to historical and projected data for precise valuation.
- Customizable Inputs: Adjust WACC, tax rates, revenue growth, and capital expenditures as needed.
- Dynamic Calculations: Intrinsic value and NPV are computed automatically.
- Scenario Analysis: Evaluate various scenarios to assess SiTime’s future performance.
- User-Friendly Design: Designed for professionals while remaining approachable for newcomers.
Key Features
- Genuine SiTime Financials: Gain access to precise pre-loaded historical data and future forecasts.
- Adjustable Forecast Parameters: Modify yellow-highlighted cells such as WACC, growth rates, and profit margins.
- Real-Time Calculations: Automatic updates for DCF, Net Present Value (NPV), and cash flow assessments.
- Interactive Dashboard: User-friendly charts and summaries to help you visualize your valuation outcomes.
- Suitable for All Levels: A straightforward, intuitive layout designed for investors, CFOs, and consultants alike.
How It Works
- 1. Access the Template: Download and open the Excel file featuring SiTime Corporation’s (SITM) preloaded data.
- 2. Adjust Assumptions: Modify key inputs such as growth rates, WACC, and capital expenditures.
- 3. View Results Instantly: The DCF model automatically computes intrinsic value and NPV.
- 4. Explore Scenarios: Evaluate various forecasts to assess different valuation outcomes.
- 5. Present with Confidence: Deliver professional valuation insights to back your decisions.
Why Choose This Calculator for SiTime Corporation (SITM)?
- Accuracy: Utilizes real SiTime financial data for reliable calculations.
- Flexibility: Allows users to easily adjust and test various input parameters.
- Time-Saving: Eliminate the need to create a DCF model from the ground up.
- Professional-Grade: Crafted with the precision and usability expected by CFOs.
- User-Friendly: Intuitive interface suitable for users with any level of financial expertise.
Who Should Use This Product?
- Investors: Evaluate SiTime Corporation’s (SITM) valuation before making investment decisions.
- CFOs and Financial Analysts: Optimize valuation processes and assess financial forecasts for SiTime Corporation.
- Startup Founders: Discover the valuation methods applied to successful public companies like SiTime Corporation.
- Consultants: Provide clients with expert valuation reports based on SiTime Corporation's financials.
- Students and Educators: Utilize real data from SiTime Corporation to teach and practice valuation strategies.
What the Template Contains
- Operating and Balance Sheet Data: Pre-filled SiTime Corporation (SITM) historical data and forecasts, including revenue, EBITDA, EBIT, and capital expenditures.
- WACC Calculation: A dedicated sheet for Weighted Average Cost of Capital (WACC), including parameters like Beta, risk-free rate, and share price.
- DCF Valuation (Unlevered and Levered): Editable Discounted Cash Flow models showing intrinsic value with detailed calculations.
- Financial Statements: Pre-loaded financial statements (annual and quarterly) to support analysis.
- Key Ratios: Includes profitability, leverage, and efficiency ratios for SiTime Corporation (SITM).
- Dashboard and Charts: Visual summary of valuation outputs and assumptions to analyze results easily.
Disclaimer
All information, articles, and product details provided on this website are for general informational and educational purposes only. We do not claim any ownership over, nor do we intend to infringe upon, any trademarks, copyrights, logos, brand names, or other intellectual property mentioned or depicted on this site. Such intellectual property remains the property of its respective owners, and any references here are made solely for identification or informational purposes, without implying any affiliation, endorsement, or partnership.
We make no representations or warranties, express or implied, regarding the accuracy, completeness, or suitability of any content or products presented. Nothing on this website should be construed as legal, tax, investment, financial, medical, or other professional advice. In addition, no part of this site—including articles or product references—constitutes a solicitation, recommendation, endorsement, advertisement, or offer to buy or sell any securities, franchises, or other financial instruments, particularly in jurisdictions where such activity would be unlawful.
All content is of a general nature and may not address the specific circumstances of any individual or entity. It is not a substitute for professional advice or services. Any actions you take based on the information provided here are strictly at your own risk. You accept full responsibility for any decisions or outcomes arising from your use of this website and agree to release us from any liability in connection with your use of, or reliance upon, the content or products found herein.