
|
SEB SA (SK.PA) Évaluation DCF |
Entièrement Modifiable: Adapté À Vos Besoins Dans Excel Ou Sheets
Conception Professionnelle: Modèles Fiables Et Conformes Aux Normes Du Secteur
Pré-Construits Pour Une Utilisation Rapide Et Efficace
Compatible MAC/PC, entièrement débloqué
Aucune Expertise N'Est Requise; Facile À Suivre
SEB SA (SK.PA) Bundle
Conçu pour la précision, notre calculatrice DCF SEB SA (SKPA) vous permet d'évaluer l'évaluation de l'entreprise à l'aide de données financières réelles, avec une flexibilité complète pour modifier tous les paramètres essentiels pour améliorer les prévisions.
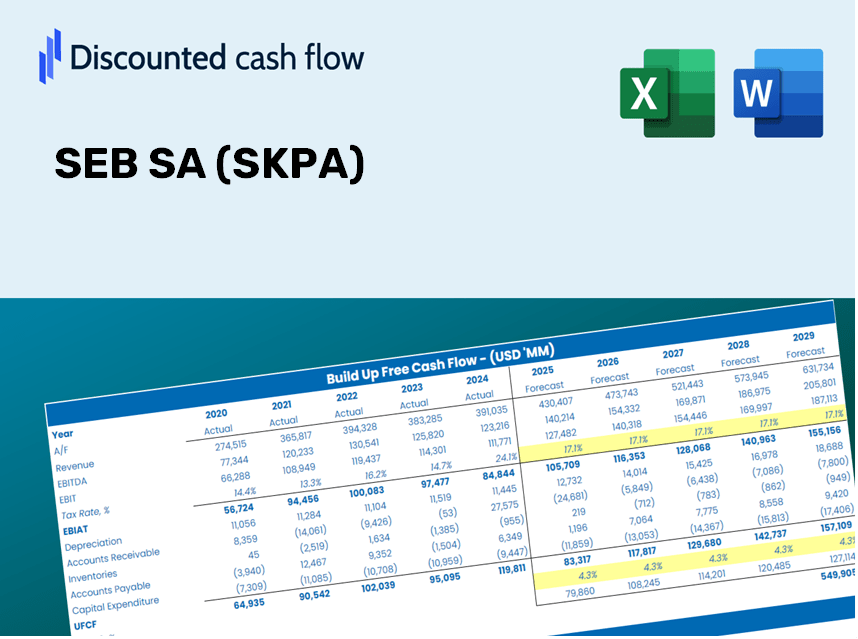
Discounted Cash Flow (DCF) - (USD MM)
| Year | AY1 2020 |
AY2 2021 |
AY3 2022 |
AY4 2023 |
AY5 2024 |
FY1 2025 |
FY2 2026 |
FY3 2027 |
FY4 2028 |
FY5 2029 |
|---|---|---|---|---|---|---|---|---|---|---|
| Revenue | 6,940.0 | 8,058.8 | 7,959.7 | 8,006.0 | 8,266.0 | 8,950.5 | 9,691.7 | 10,494.3 | 11,363.4 | 12,304.4 |
| Revenue Growth, % | 0 | 16.12 | -1.23 | 0.58168 | 3.25 | 8.28 | 8.28 | 8.28 | 8.28 | 8.28 |
| EBITDA | 752.8 | 959.9 | 775.7 | 913.6 | 804.0 | 960.2 | 1,039.8 | 1,125.9 | 1,219.1 | 1,320.1 |
| EBITDA, % | 10.85 | 11.91 | 9.75 | 11.41 | 9.73 | 10.73 | 10.73 | 10.73 | 10.73 | 10.73 |
| Depreciation | 270.5 | 266.5 | 274.3 | 283.7 | 294.9 | 318.0 | 344.3 | 372.8 | 403.7 | 437.1 |
| Depreciation, % | 3.9 | 3.31 | 3.45 | 3.54 | 3.57 | 3.55 | 3.55 | 3.55 | 3.55 | 3.55 |
| EBIT | 482.3 | 693.4 | 501.4 | 629.9 | 509.1 | 642.3 | 695.5 | 753.1 | 815.4 | 883.0 |
| EBIT, % | 6.95 | 8.6 | 6.3 | 7.87 | 6.16 | 7.18 | 7.18 | 7.18 | 7.18 | 7.18 |
| Total Cash | 2,434.1 | 2,327.1 | 1,339.0 | 1,526.8 | 1,143.8 | 2,035.0 | 2,203.5 | 2,386.0 | 2,583.6 | 2,797.5 |
| Total Cash, percent | .0 | .0 | .0 | .0 | .0 | .0 | .0 | .0 | .0 | .0 |
| Account Receivables | 1,100.4 | 1,089.1 | 1,052.8 | 1,162.4 | 1,141.9 | 1,269.7 | 1,374.9 | 1,488.7 | 1,612.0 | 1,745.5 |
| Account Receivables, % | 15.86 | 13.51 | 13.23 | 14.52 | 13.81 | 14.19 | 14.19 | 14.19 | 14.19 | 14.19 |
| Inventories | 1,211.5 | 1,839.6 | 1,682.1 | 1,474.8 | 1,645.6 | 1,785.6 | 1,933.4 | 2,093.5 | 2,266.9 | 2,454.6 |
| Inventories, % | 17.46 | 22.83 | 21.13 | 18.42 | 19.91 | 19.95 | 19.95 | 19.95 | 19.95 | 19.95 |
| Accounts Payable | 1,260.3 | 1,614.7 | 1,027.1 | 1,160.6 | 1,211.1 | 1,436.5 | 1,555.5 | 1,684.3 | 1,823.8 | 1,974.8 |
| Accounts Payable, % | 18.16 | 20.04 | 12.9 | 14.5 | 14.65 | 16.05 | 16.05 | 16.05 | 16.05 | 16.05 |
| Capital Expenditure | -182.5 | -212.9 | -232.8 | -175.7 | -173.5 | -223.6 | -242.1 | -262.1 | -283.9 | -307.4 |
| Capital Expenditure, % | -2.63 | -2.64 | -2.92 | -2.19 | -2.1 | -2.5 | -2.5 | -2.5 | -2.5 | -2.5 |
| Tax Rate, % | 44.79 | 44.79 | 44.79 | 44.79 | 44.79 | 44.79 | 44.79 | 44.79 | 44.79 | 44.79 |
| EBITAT | 327.5 | 483.9 | 340.0 | 414.4 | 281.1 | 419.4 | 454.2 | 491.8 | 532.5 | 576.6 |
| Depreciation | ||||||||||
| Changes in Account Receivables | ||||||||||
| Changes in Inventories | ||||||||||
| Changes in Accounts Payable | ||||||||||
| Capital Expenditure | ||||||||||
| UFCF | -636.1 | 275.1 | -12.3 | 753.6 | 302.7 | 471.4 | 422.3 | 457.3 | 495.1 | 536.1 |
| WACC, % | 5.38 | 5.42 | 5.38 | 5.34 | 5.14 | 5.33 | 5.33 | 5.33 | 5.33 | 5.33 |
| PV UFCF | ||||||||||
| SUM PV UFCF | 2,035.2 | |||||||||
| Long Term Growth Rate, % | 3.50 | |||||||||
| Free cash flow (T + 1) | 555 | |||||||||
| Terminal Value | 30,272 | |||||||||
| Present Terminal Value | 23,346 | |||||||||
| Enterprise Value | 25,381 | |||||||||
| Net Debt | 2,035 | |||||||||
| Equity Value | 23,346 | |||||||||
| Diluted Shares Outstanding, MM | 55 | |||||||||
| Equity Value Per Share | 425.66 |
What You Will Receive
- Adjustable Forecast Inputs: Effortlessly modify key assumptions (growth %, margins, WACC) to generate various scenarios.
- Comprehensive Data: SEB SA's financial data pre-loaded to accelerate your analysis.
- Instant DCF Outputs: The template computes Net Present Value (NPV) and intrinsic value automatically.
- Customizable and Professional Design: A refined Excel model tailored to meet your valuation requirements.
- Designed for Analysts and Investors: Perfect for evaluating projections, confirming strategies, and enhancing efficiency.
Key Features
- Pre-Loaded Data: SEB SA’s historical financial statements and pre-filled forecasts.
- Fully Adjustable Inputs: Customize WACC, tax rates, revenue growth, and EBITDA margins.
- Instant Results: Watch SEB SA’s intrinsic value update in real time.
- Clear Visual Outputs: Dashboard charts illustrate valuation results and essential metrics.
- Built for Accuracy: A professional tool designed for analysts, investors, and finance professionals.
How It Operates
- Step 1: Download the prebuilt Excel template featuring SEB SA’s (SKPA) data.
- Step 2: Browse through the pre-filled sheets to familiarize yourself with the essential metrics.
- Step 3: Modify forecasts and assumptions in the editable yellow cells (WACC, growth, margins).
- Step 4: View the updated results immediately, including SEB SA’s (SKPA) intrinsic value.
- Step 5: Use the outputs to make well-informed investment decisions or create reports.
Why Opt for This Calculator?
- Precise Data: Accurate SEB SA (SKPA) financials ensure trustworthy valuation outcomes.
- Customizable: Tailor essential variables such as growth rates, WACC, and tax rates to align with your forecasts.
- Time-Efficient: Built-in calculations save you the hassle of starting from the ground up.
- Professional-Grade Tool: Tailored for investors, analysts, and financial consultants.
- User-Friendly: Streamlined design and easy-to-follow instructions make it accessible for everyone.
Who Can Benefit from This Product?
- Investors: Evaluate the valuation of SEB SA (SKPA) prior to making stock transactions.
- CFOs and Financial Analysts: Enhance valuation processes and assess financial projections.
- Startup Founders: Understand how large public companies like SEB SA (SKPA) are valued.
- Consultants: Provide comprehensive valuation reports for your clientele.
- Students and Educators: Utilize actual data to learn and teach valuation methodologies.
Contents of the Template
- Preloaded SEB SA Data: Historical and projected financial metrics, including revenue, EBIT, and capital expenditures.
- DCF and WACC Models: High-quality spreadsheets for determining intrinsic value and Weighted Average Cost of Capital.
- Editable Inputs: Cells highlighted in yellow for modifying revenue growth, tax rates, and discount rates.
- Financial Statements: Detailed annual and quarterly financial reports for in-depth analysis.
- Key Ratios: Ratios for profitability, leverage, and efficiency to assess company performance.
- Dashboard and Charts: Visual representations of valuation results and underlying assumptions.
Disclaimer
All information, articles, and product details provided on this website are for general informational and educational purposes only. We do not claim any ownership over, nor do we intend to infringe upon, any trademarks, copyrights, logos, brand names, or other intellectual property mentioned or depicted on this site. Such intellectual property remains the property of its respective owners, and any references here are made solely for identification or informational purposes, without implying any affiliation, endorsement, or partnership.
We make no representations or warranties, express or implied, regarding the accuracy, completeness, or suitability of any content or products presented. Nothing on this website should be construed as legal, tax, investment, financial, medical, or other professional advice. In addition, no part of this site—including articles or product references—constitutes a solicitation, recommendation, endorsement, advertisement, or offer to buy or sell any securities, franchises, or other financial instruments, particularly in jurisdictions where such activity would be unlawful.
All content is of a general nature and may not address the specific circumstances of any individual or entity. It is not a substitute for professional advice or services. Any actions you take based on the information provided here are strictly at your own risk. You accept full responsibility for any decisions or outcomes arising from your use of this website and agree to release us from any liability in connection with your use of, or reliance upon, the content or products found herein.