
|
Évaluation DCF Snap Inc. (SNAP) |
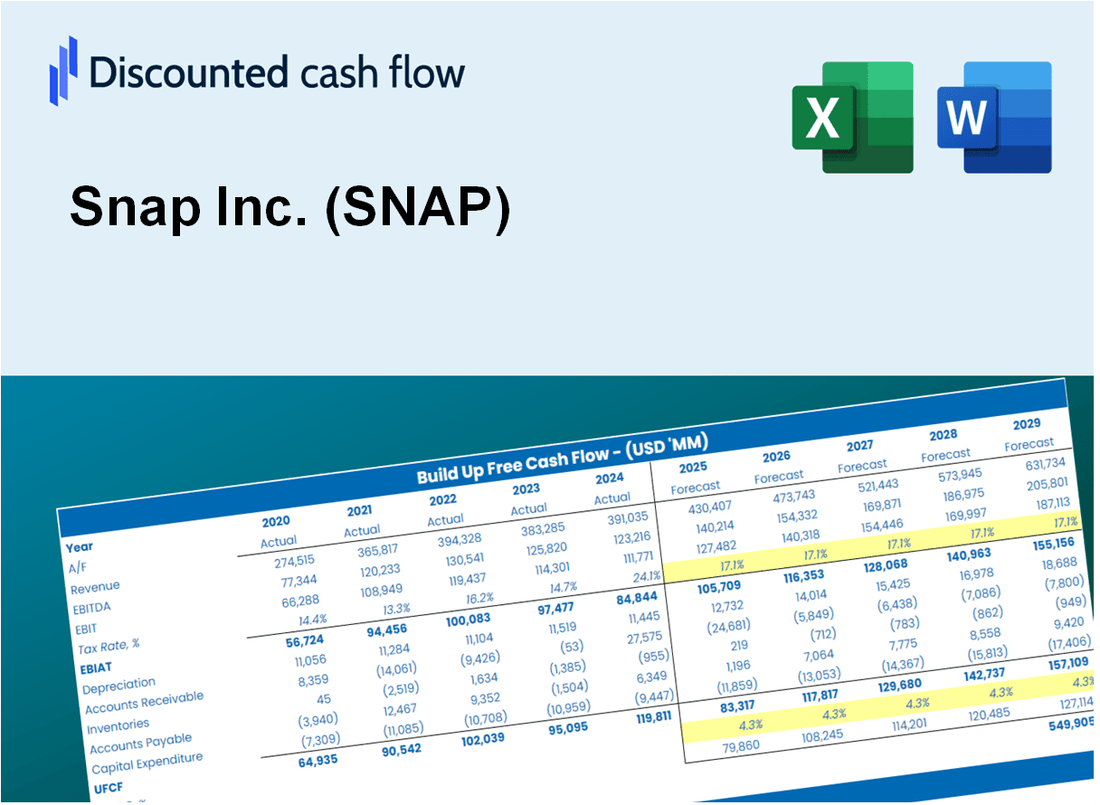
Entièrement Modifiable: Adapté À Vos Besoins Dans Excel Ou Sheets
Conception Professionnelle: Modèles Fiables Et Conformes Aux Normes Du Secteur
Pré-Construits Pour Une Utilisation Rapide Et Efficace
Compatible MAC/PC, entièrement débloqué
Aucune Expertise N'Est Requise; Facile À Suivre
Snap Inc. (SNAP) Bundle
Explorez l'avenir financier Snap Inc. (SNAP) avec notre calculatrice DCF facile à utiliser! Entrez vos projections pour la croissance, les marges et les dépenses pour déterminer la valeur intrinsèque SNAP Inc. (SNAP) et améliorer votre approche d'investissement.
What You Will Get
- Editable Forecast Inputs: Easily modify key assumptions (growth %, margins, WACC) to explore various scenarios.
- Real-World Data: Snap Inc.'s (SNAP) financial data pre-loaded to facilitate your analysis.
- Automatic DCF Outputs: The template computes Net Present Value (NPV) and intrinsic value automatically.
- Customizable and Professional: A sleek Excel model that can be tailored to your valuation requirements.
- Built for Analysts and Investors: Perfect for testing forecasts, validating strategies, and enhancing efficiency.
Key Features
- Customizable Forecast Inputs: Adjust essential metrics such as user growth, revenue per user, and operating expenses.
- Instant DCF Valuation: Quickly computes intrinsic value, NPV, and various financial metrics.
- High Precision Results: Leverages Snap Inc.’s actual financial data for accurate valuation insights.
- Simplified Scenario Testing: Easily explore different assumptions and assess their impact on outcomes.
- Efficiency Booster: Avoid the hassle of constructing intricate valuation models from the ground up.
How It Works
- Step 1: Download the prebuilt Excel template with Snap Inc.'s (SNAP) data included.
- Step 2: Explore the pre-filled sheets and familiarize yourself with the key metrics.
- Step 3: Update forecasts and assumptions in the editable yellow cells (WACC, growth, margins).
- Step 4: Instantly view recalculated results, including Snap Inc.'s (SNAP) intrinsic value.
- Step 5: Make informed investment decisions or generate reports using the outputs.
Why Choose This Calculator for Snap Inc. (SNAP)?
- All-in-One Solution: Features DCF, WACC, and financial ratio analyses tailored for Snap Inc. (SNAP).
- Flexible Inputs: Modify yellow-highlighted cells to explore different financial scenarios.
- In-Depth Analysis: Automatically computes Snap Inc.'s (SNAP) intrinsic value and Net Present Value.
- Preloaded Information: Includes historical and projected data for precise calculations.
- High-Quality Standards: Perfect for financial analysts, investors, and business consultants focused on Snap Inc. (SNAP).
Who Should Use This Product?
- Investors: Assess Snap Inc.’s valuation before making stock trades.
- CFOs and Financial Analysts: Optimize valuation processes and evaluate financial forecasts.
- Startup Founders: Understand how established companies like Snap Inc. are valued in the market.
- Consultants: Provide comprehensive valuation reports for your clients.
- Students and Educators: Utilize current data to learn and teach valuation methodologies.
What the Template Contains
- Operating and Balance Sheet Data: Pre-filled Snap Inc. (SNAP) historical data and forecasts, including revenue, EBITDA, EBIT, and capital expenditures.
- WACC Calculation: A dedicated sheet for Weighted Average Cost of Capital (WACC), including parameters like Beta, risk-free rate, and share price.
- DCF Valuation (Unlevered and Levered): Editable Discounted Cash Flow models showing intrinsic value with detailed calculations.
- Financial Statements: Pre-loaded financial statements (annual and quarterly) to support analysis.
- Key Ratios: Includes profitability, leverage, and efficiency ratios for Snap Inc. (SNAP).
- Dashboard and Charts: Visual summary of valuation outputs and assumptions to analyze results easily.
Disclaimer
All information, articles, and product details provided on this website are for general informational and educational purposes only. We do not claim any ownership over, nor do we intend to infringe upon, any trademarks, copyrights, logos, brand names, or other intellectual property mentioned or depicted on this site. Such intellectual property remains the property of its respective owners, and any references here are made solely for identification or informational purposes, without implying any affiliation, endorsement, or partnership.
We make no representations or warranties, express or implied, regarding the accuracy, completeness, or suitability of any content or products presented. Nothing on this website should be construed as legal, tax, investment, financial, medical, or other professional advice. In addition, no part of this site—including articles or product references—constitutes a solicitation, recommendation, endorsement, advertisement, or offer to buy or sell any securities, franchises, or other financial instruments, particularly in jurisdictions where such activity would be unlawful.
All content is of a general nature and may not address the specific circumstances of any individual or entity. It is not a substitute for professional advice or services. Any actions you take based on the information provided here are strictly at your own risk. You accept full responsibility for any decisions or outcomes arising from your use of this website and agree to release us from any liability in connection with your use of, or reliance upon, the content or products found herein.