
|
SNDL Inc. (SNDL) Évaluation DCF |
Entièrement Modifiable: Adapté À Vos Besoins Dans Excel Ou Sheets
Conception Professionnelle: Modèles Fiables Et Conformes Aux Normes Du Secteur
Pré-Construits Pour Une Utilisation Rapide Et Efficace
Compatible MAC/PC, entièrement débloqué
Aucune Expertise N'Est Requise; Facile À Suivre
SNDL Inc. (SNDL) Bundle
Explorez l'avenir financier de SNDL Inc. (SNDL) avec notre calculatrice DCF conviviale! Entrez vos projections pour la croissance, les marges et les dépenses pour calculer la valeur intrinsèque de SNDL Inc. (SNDL) et façonner votre approche d'investissement.
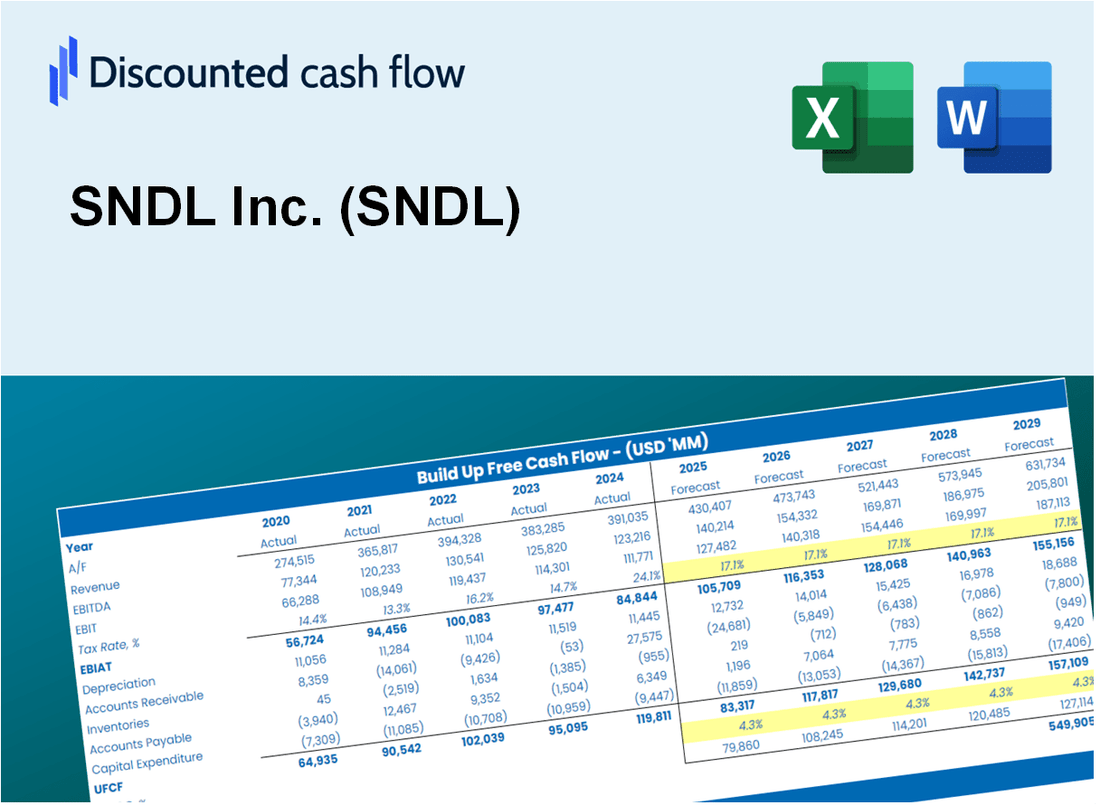
Discounted Cash Flow (DCF) - (USD MM)
| Year | AY1 2020 |
AY2 2021 |
AY3 2022 |
AY4 2023 |
AY5 2024 |
FY1 2025 |
FY2 2026 |
FY3 2027 |
FY4 2028 |
FY5 2029 |
|---|---|---|---|---|---|---|---|---|---|---|
| Revenue | 43.3 | 39.9 | 506.6 | 646.6 | 654.8 | 852.9 | 1,110.9 | 1,447.1 | 1,884.9 | 2,455.3 |
| Revenue Growth, % | 0 | -7.86 | 1168.88 | 27.63 | 1.26 | 30.26 | 30.26 | 30.26 | 30.26 | 30.26 |
| EBITDA | -132.0 | -159.2 | -232.3 | -70.5 | -29.3 | -445.6 | -580.4 | -756.1 | -984.8 | -1,282.8 |
| EBITDA, % | -304.58 | -398.66 | -45.85 | -10.91 | -4.48 | -52.25 | -52.25 | -52.25 | -52.25 | -52.25 |
| Depreciation | 8.2 | 7.2 | 33.7 | 46.2 | 40.3 | 97.4 | 126.8 | 165.2 | 215.2 | 280.3 |
| Depreciation, % | 19.01 | 18.11 | 6.64 | 7.14 | 6.16 | 11.41 | 11.41 | 11.41 | 11.41 | 11.41 |
| EBIT | -140.2 | -166.4 | -266.0 | -116.7 | -69.7 | -479.6 | -624.8 | -813.8 | -1,060.0 | -1,380.8 |
| EBIT, % | -323.59 | -416.77 | -52.49 | -18.05 | -10.64 | -56.24 | -56.24 | -56.24 | -56.24 | -56.24 |
| Total Cash | 42.9 | 461.7 | 221.8 | 143.4 | 177.1 | 498.3 | 649.0 | 845.4 | 1,101.2 | 1,434.4 |
| Total Cash, percent | .0 | .0 | .0 | .0 | .0 | .0 | .0 | .0 | .0 | .0 |
| Account Receivables | 11.3 | 7.7 | 16.1 | 19.2 | 20.0 | 93.2 | 121.5 | 158.2 | 206.1 | 268.4 |
| Account Receivables, % | 26.1 | 19.36 | 3.18 | 2.98 | 3.05 | 10.93 | 10.93 | 10.93 | 10.93 | 10.93 |
| Inventories | 20.7 | 24.1 | 93.4 | 92.1 | 91.8 | 264.3 | 344.3 | 448.5 | 584.2 | 761.0 |
| Inventories, % | 47.84 | 60.42 | 18.43 | 14.25 | 14.03 | 30.99 | 30.99 | 30.99 | 30.99 | 30.99 |
| Accounts Payable | 3.4 | 3.0 | 7.0 | 15.7 | 19.3 | 37.7 | 49.2 | 64.0 | 83.4 | 108.7 |
| Accounts Payable, % | 7.96 | 7.43 | 1.37 | 2.42 | 2.94 | 4.43 | 4.43 | 4.43 | 4.43 | 4.43 |
| Capital Expenditure | -2.3 | -2.7 | -7.7 | -5.6 | -7.8 | -26.5 | -34.6 | -45.0 | -58.7 | -76.4 |
| Capital Expenditure, % | -5.21 | -6.76 | -1.53 | -0.8726 | -1.2 | -3.11 | -3.11 | -3.11 | -3.11 | -3.11 |
| Tax Rate, % | 10.24 | 10.24 | 10.24 | 10.24 | 10.24 | 10.24 | 10.24 | 10.24 | 10.24 | 10.24 |
| EBITAT | -158.5 | -160.9 | -234.7 | -117.2 | -62.5 | -455.4 | -593.2 | -772.6 | -1,006.4 | -1,310.9 |
| Depreciation | ||||||||||
| Changes in Account Receivables | ||||||||||
| Changes in Inventories | ||||||||||
| Changes in Accounts Payable | ||||||||||
| Capital Expenditure | ||||||||||
| UFCF | -181.1 | -156.7 | -282.4 | -69.8 | -26.9 | -611.8 | -597.7 | -778.6 | -1,014.1 | -1,321.0 |
| WACC, % | 6.14 | 6.11 | 6.02 | 6.14 | 6.04 | 6.09 | 6.09 | 6.09 | 6.09 | 6.09 |
| PV UFCF | ||||||||||
| SUM PV UFCF | -3,543.6 | |||||||||
| Long Term Growth Rate, % | 2.00 | |||||||||
| Free cash flow (T + 1) | -1,347 | |||||||||
| Terminal Value | -32,963 | |||||||||
| Present Terminal Value | -24,531 | |||||||||
| Enterprise Value | -28,074 | |||||||||
| Net Debt | -47 | |||||||||
| Equity Value | -28,027 | |||||||||
| Diluted Shares Outstanding, MM | 264 | |||||||||
| Equity Value Per Share | -106.08 |
What You Will Get
- Editable Forecast Inputs: Easily modify key assumptions (growth %, margins, WACC) to explore various scenarios.
- Real-World Data: SNDL Inc.’s financial data pre-loaded to facilitate your analysis.
- Automatic DCF Outputs: The template automatically calculates Net Present Value (NPV) and intrinsic value for your convenience.
- Customizable and Professional: A refined Excel model that adjusts to meet your valuation requirements.
- Built for Analysts and Investors: Perfect for evaluating projections, confirming strategies, and enhancing efficiency.
Key Features
- Pre-Loaded Data: SNDL Inc.'s historical financial statements and pre-filled forecasts.
- Fully Adjustable Inputs: Customize WACC, tax rates, revenue growth, and EBITDA margins.
- Instant Results: View SNDL Inc.'s intrinsic value recalculating in real time.
- Clear Visual Outputs: Dashboard charts illustrate valuation results and essential metrics.
- Built for Accuracy: A professional tool designed for analysts, investors, and finance professionals.
How It Works
- Step 1: Download the Excel file.
- Step 2: Review pre-entered SNDL Inc. (SNDL) data (historical and projected).
- Step 3: Adjust key assumptions (yellow cells) based on your analysis.
- Step 4: View automatic recalculations for SNDL Inc.'s intrinsic value.
- Step 5: Use the outputs for investment decisions or reporting.
Why Choose This Calculator for SNDL Inc. (SNDL)?
- Designed for Experts: A specialized tool utilized by financial analysts, CFOs, and industry consultants.
- Accurate Financial Data: SNDL’s historical and projected financial information is preloaded for precision.
- Flexible Scenario Analysis: Effortlessly simulate various forecasts and assumptions.
- Comprehensive Outputs: Automatically computes intrinsic value, NPV, and essential financial metrics.
- User-Friendly: Step-by-step guidance ensures a smooth experience throughout the process.
Who Should Use This Product?
- Investors: Evaluate SNDL Inc.'s valuation before making investment decisions.
- CFOs and Financial Analysts: Optimize valuation methodologies and assess financial forecasts.
- Startup Founders: Understand the valuation strategies of established companies like SNDL Inc.
- Consultants: Provide comprehensive valuation analyses and reports for clients.
- Students and Educators: Utilize current market data to learn and teach valuation principles.
What the Template Contains
- Preloaded SNDL Data: Historical and projected financial data, including revenue, EBIT, and capital expenditures.
- DCF and WACC Models: Professional-grade sheets for calculating intrinsic value and Weighted Average Cost of Capital.
- Editable Inputs: Yellow-highlighted cells for adjusting revenue growth, tax rates, and discount rates.
- Financial Statements: Comprehensive annual and quarterly financials for deeper analysis.
- Key Ratios: Profitability, leverage, and efficiency ratios to evaluate performance.
- Dashboard and Charts: Visual summaries of valuation outcomes and assumptions.
Disclaimer
All information, articles, and product details provided on this website are for general informational and educational purposes only. We do not claim any ownership over, nor do we intend to infringe upon, any trademarks, copyrights, logos, brand names, or other intellectual property mentioned or depicted on this site. Such intellectual property remains the property of its respective owners, and any references here are made solely for identification or informational purposes, without implying any affiliation, endorsement, or partnership.
We make no representations or warranties, express or implied, regarding the accuracy, completeness, or suitability of any content or products presented. Nothing on this website should be construed as legal, tax, investment, financial, medical, or other professional advice. In addition, no part of this site—including articles or product references—constitutes a solicitation, recommendation, endorsement, advertisement, or offer to buy or sell any securities, franchises, or other financial instruments, particularly in jurisdictions where such activity would be unlawful.
All content is of a general nature and may not address the specific circumstances of any individual or entity. It is not a substitute for professional advice or services. Any actions you take based on the information provided here are strictly at your own risk. You accept full responsibility for any decisions or outcomes arising from your use of this website and agree to release us from any liability in connection with your use of, or reliance upon, the content or products found herein.