
|
Synaptogenix, Inc. (SNPX) Valation DCF |
Entièrement Modifiable: Adapté À Vos Besoins Dans Excel Ou Sheets
Conception Professionnelle: Modèles Fiables Et Conformes Aux Normes Du Secteur
Pré-Construits Pour Une Utilisation Rapide Et Efficace
Compatible MAC/PC, entièrement débloqué
Aucune Expertise N'Est Requise; Facile À Suivre
Synaptogenix, Inc. (SNPX) Bundle
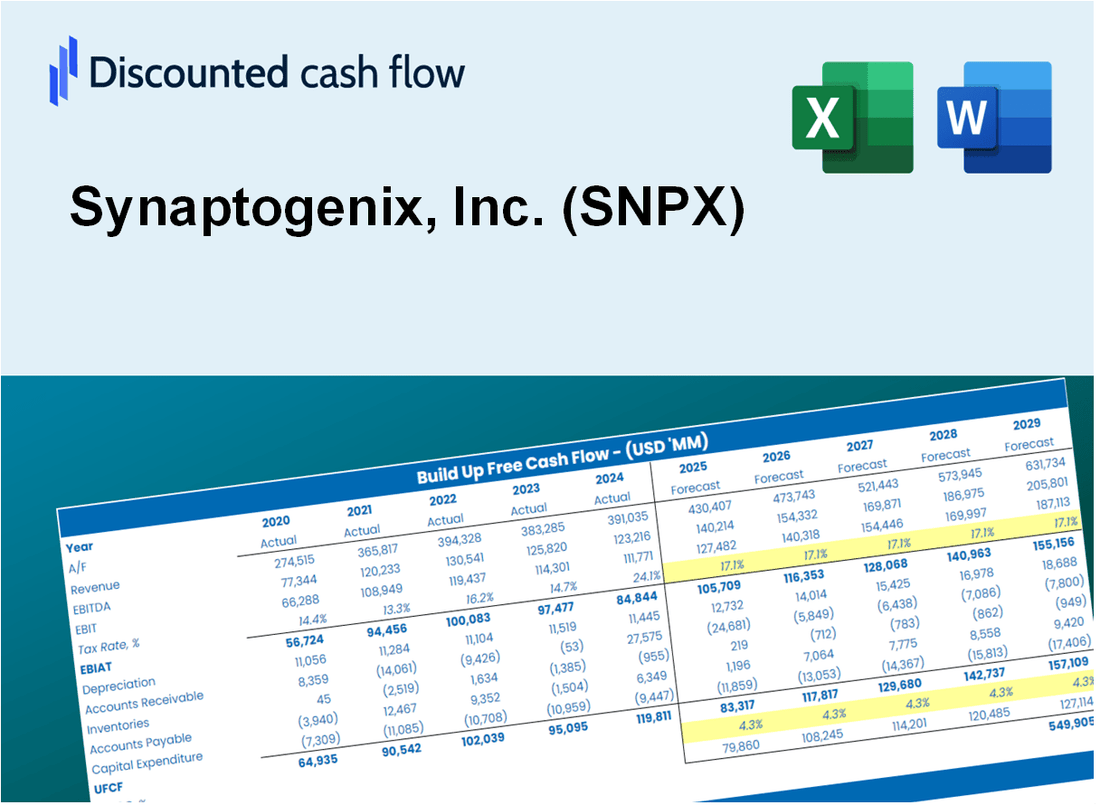
Gardez un aperçu de votre analyse d'évaluation de SynaptoGenix, Inc. (SNPX) à l'aide de notre calculatrice sophistiquée DCF! Ce modèle Excel est préchargé avec de vraies données SNPX, vous permettant d'ajuster les prévisions et les hypothèses pour déterminer avec précision la valeur intrinsèque de SynaptoGenix.
Discounted Cash Flow (DCF) - (USD MM)
| Year | AY1 2020 |
AY2 2021 |
AY3 2022 |
AY4 2023 |
AY5 2024 |
FY1 2025 |
FY2 2026 |
FY3 2027 |
FY4 2028 |
FY5 2029 |
|---|---|---|---|---|---|---|---|---|---|---|
| Revenue | .0 | .0 | .0 | .0 | .0 | .0 | .0 | .0 | .0 | .0 |
| Revenue Growth, % | 0 | 0 | 0 | 0 | 0 | 0 | 0 | 0 | 0 | 0 |
| EBITDA | -11.2 | -12.6 | -16.1 | -8.3 | -12.8 | .0 | .0 | .0 | .0 | .0 |
| EBITDA, % | 100 | 100 | 100 | 100 | 100 | 100 | 100 | 100 | 100 | 100 |
| Depreciation | .0 | .0 | .0 | .0 | .0 | .0 | .0 | .0 | .0 | .0 |
| Depreciation, % | 100 | 100 | 100 | 100 | 100 | 100 | 100 | 100 | 100 | 100 |
| EBIT | -11.2 | -12.6 | -16.1 | -8.3 | -12.8 | .0 | .0 | .0 | .0 | .0 |
| EBIT, % | 100 | 100 | 100 | 100 | 100 | 100 | 100 | 100 | 100 | 100 |
| Total Cash | 5.8 | 34.2 | 37.5 | 30.1 | 17.7 | .0 | .0 | .0 | .0 | .0 |
| Total Cash, percent | .0 | .0 | .0 | .0 | .0 | .0 | .0 | .0 | .0 | .0 |
| Account Receivables | .1 | .0 | .0 | .0 | .0 | .0 | .0 | .0 | .0 | .0 |
| Account Receivables, % | 100 | 100 | 100 | 100 | 100 | 100 | 100 | 100 | 100 | 100 |
| Inventories | .0 | .0 | .0 | .0 | .0 | .0 | .0 | .0 | .0 | .0 |
| Inventories, % | 100 | 100 | 100 | 100 | 100 | 100 | 100 | 100 | 100 | 100 |
| Accounts Payable | 1.3 | 1.3 | .7 | .4 | .3 | .0 | .0 | .0 | .0 | .0 |
| Accounts Payable, % | 100 | 100 | 100 | 100 | 100 | 100 | 100 | 100 | 100 | 100 |
| Capital Expenditure | .0 | .0 | .0 | .0 | .0 | .0 | .0 | .0 | .0 | .0 |
| Capital Expenditure, % | 100 | 100 | 100 | 100 | 100 | 0 | 0 | 0 | 0 | 0 |
| Tax Rate, % | 0 | 0 | 0 | 0 | 0 | 0 | 0 | 0 | 0 | 0 |
| EBITAT | -12.5 | -12.6 | -15.8 | -8.3 | -12.8 | .0 | .0 | .0 | .0 | .0 |
| Depreciation | ||||||||||
| Changes in Account Receivables | ||||||||||
| Changes in Inventories | ||||||||||
| Changes in Accounts Payable | ||||||||||
| Capital Expenditure | ||||||||||
| UFCF | -11.4 | -12.4 | -16.4 | -8.5 | -12.9 | -.3 | .0 | .0 | .0 | .0 |
| WACC, % | 10.12 | 10.12 | 10.12 | 10.12 | 10.12 | 10.12 | 10.12 | 10.12 | 10.12 | 10.12 |
| PV UFCF | ||||||||||
| SUM PV UFCF | -.3 | |||||||||
| Long Term Growth Rate, % | 2.00 | |||||||||
| Free cash flow (T + 1) | 0 | |||||||||
| Terminal Value | 0 | |||||||||
| Present Terminal Value | 0 | |||||||||
| Enterprise Value | 0 | |||||||||
| Net Debt | -18 | |||||||||
| Equity Value | 17 | |||||||||
| Diluted Shares Outstanding, MM | 1 | |||||||||
| Equity Value Per Share | 14.08 |
What You Will Get
- Editable Excel Template: A fully customizable Excel-based DCF Calculator featuring pre-filled real SNPX financials.
- Real-World Data: Historical data and forward-looking estimates (highlighted in the yellow cells).
- Forecast Flexibility: Adjust forecast assumptions such as revenue growth, EBITDA %, and WACC.
- Automatic Calculations: Instantly visualize the effect of your inputs on Synaptogenix’s valuation.
- Professional Tool: Designed for investors, CFOs, consultants, and financial analysts.
- User-Friendly Design: Organized for clarity and ease of use, complete with step-by-step instructions.
Key Features
- Customizable Research Inputs: Adjust essential parameters such as market trends, revenue projections, and R&D expenditures.
- Instant DCF Valuation: Quickly computes intrinsic value, NPV, and other financial metrics.
- High-Precision Analytics: Leverages Synaptogenix's (SNPX) actual financial data for accurate valuation results.
- Seamless Scenario Testing: Evaluate various assumptions and analyze results effortlessly.
- Efficiency Booster: Avoid the hassle of creating intricate valuation models from the ground up.
How It Works
- Step 1: Download the prebuilt Excel template featuring Synaptogenix, Inc. (SNPX) data.
- Step 2: Review the pre-filled sheets to familiarize yourself with the essential metrics.
- Step 3: Adjust forecasts and assumptions in the editable yellow cells (WACC, growth, margins).
- Step 4: Instantly see recalculated results, including Synaptogenix, Inc. (SNPX) intrinsic value.
- Step 5: Make well-informed investment choices or create reports based on the outputs.
Why Choose This Calculator for Synaptogenix, Inc. (SNPX)?
- User-Friendly Interface: Tailored for both novices and seasoned professionals.
- Customizable Variables: Adjust inputs effortlessly to suit your analytical needs.
- Real-Time Feedback: Observe immediate updates to Synaptogenix’s valuation as you modify inputs.
- Pre-Configured Data: Comes with Synaptogenix’s actual financial information for swift evaluations.
- Relied Upon by Experts: Employed by investors and analysts for making well-informed choices.
Who Should Use This Product?
- Individual Investors: Make informed decisions about buying or selling Synaptogenix, Inc. (SNPX) stock.
- Financial Analysts: Enhance valuation processes with accessible financial models tailored for Synaptogenix, Inc. (SNPX).
- Consultants: Provide expert valuation insights on Synaptogenix, Inc. (SNPX) to clients efficiently and accurately.
- Business Owners: Gain insights into the valuation of biotech firms like Synaptogenix, Inc. (SNPX) to inform your own business strategies.
- Finance Students: Explore valuation methodologies using real-world data and case studies related to Synaptogenix, Inc. (SNPX).
What the Template Contains
- Pre-Filled Data: Includes Synaptogenix, Inc.’s (SNPX) historical financials and forecasts.
- Discounted Cash Flow Model: Editable DCF valuation model with automatic calculations.
- Weighted Average Cost of Capital (WACC): A dedicated sheet for calculating WACC based on custom inputs.
- Key Financial Ratios: Analyze Synaptogenix, Inc.’s (SNPX) profitability, efficiency, and leverage.
- Customizable Inputs: Edit revenue growth, margins, and tax rates with ease.
- Clear Dashboard: Charts and tables summarizing key valuation results.
Disclaimer
All information, articles, and product details provided on this website are for general informational and educational purposes only. We do not claim any ownership over, nor do we intend to infringe upon, any trademarks, copyrights, logos, brand names, or other intellectual property mentioned or depicted on this site. Such intellectual property remains the property of its respective owners, and any references here are made solely for identification or informational purposes, without implying any affiliation, endorsement, or partnership.
We make no representations or warranties, express or implied, regarding the accuracy, completeness, or suitability of any content or products presented. Nothing on this website should be construed as legal, tax, investment, financial, medical, or other professional advice. In addition, no part of this site—including articles or product references—constitutes a solicitation, recommendation, endorsement, advertisement, or offer to buy or sell any securities, franchises, or other financial instruments, particularly in jurisdictions where such activity would be unlawful.
All content is of a general nature and may not address the specific circumstances of any individual or entity. It is not a substitute for professional advice or services. Any actions you take based on the information provided here are strictly at your own risk. You accept full responsibility for any decisions or outcomes arising from your use of this website and agree to release us from any liability in connection with your use of, or reliance upon, the content or products found herein.