
|
Sofi Technologies, Inc. (SOFI) Évaluation DCF |
Entièrement Modifiable: Adapté À Vos Besoins Dans Excel Ou Sheets
Conception Professionnelle: Modèles Fiables Et Conformes Aux Normes Du Secteur
Pré-Construits Pour Une Utilisation Rapide Et Efficace
Compatible MAC/PC, entièrement débloqué
Aucune Expertise N'Est Requise; Facile À Suivre
SoFi Technologies, Inc. (SOFI) Bundle
Évaluer Sofi Technologies, Inc. (SOFI) Perspectives financières comme un expert! Ce (SOFI) Calculator DCF vous fournit des données financières pré-remplies et une pleine flexibilité pour modifier la croissance des revenus, le WACC, les marges et d'autres hypothèses essentielles pour s'aligner sur vos projections.
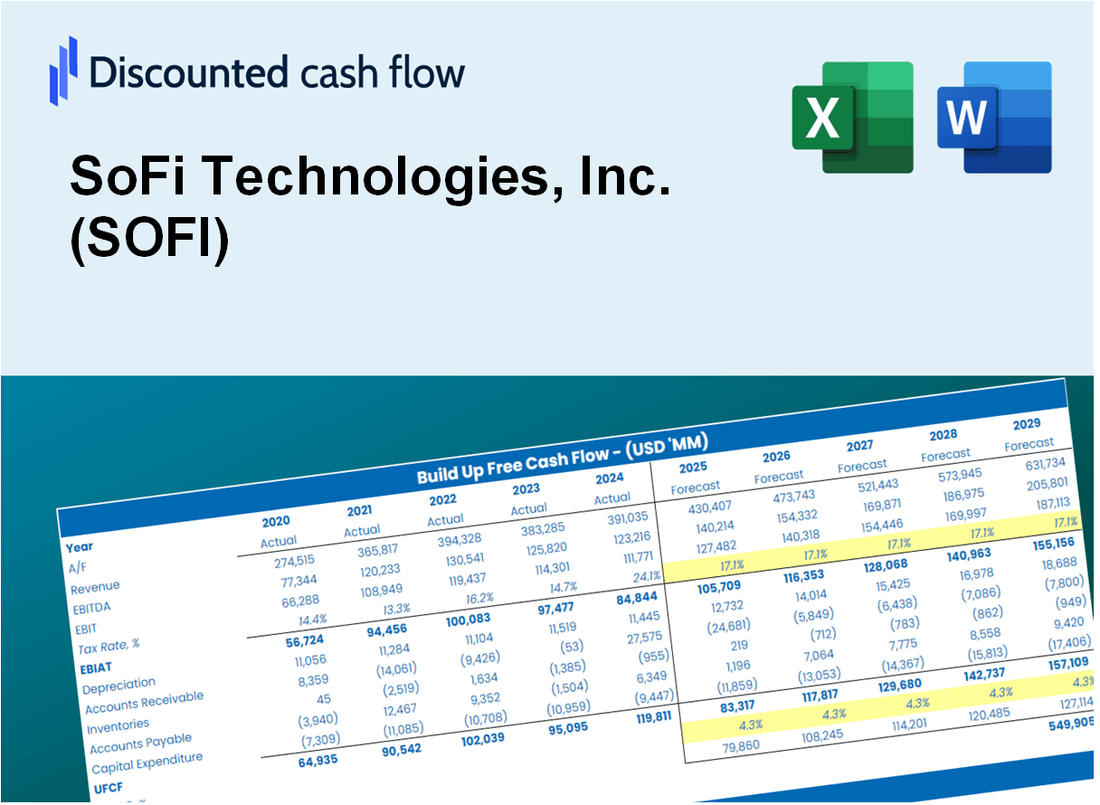
Discounted Cash Flow (DCF) - (USD MM)
| Year | AY1 2020 |
AY2 2021 |
AY3 2022 |
AY4 2023 |
AY5 2024 |
FY1 2025 |
FY2 2026 |
FY3 2027 |
FY4 2028 |
FY5 2029 |
|---|---|---|---|---|---|---|---|---|---|---|
| Revenue | 751.1 | 1,087.6 | 1,762.8 | 2,897.5 | 3,703.7 | 5,546.9 | 8,307.4 | 12,441.7 | 18,633.6 | 27,906.9 |
| Revenue Growth, % | 0 | 44.8 | 62.08 | 64.37 | 27.82 | 49.77 | 49.77 | 49.77 | 49.77 | 49.77 |
| EBITDA | -258.7 | -379.6 | -167.4 | -99.7 | 436.8 | -781.9 | -1,171.1 | -1,753.9 | -2,626.7 | -3,933.9 |
| EBITDA, % | -34.44 | -34.9 | -9.49 | -3.44 | 11.79 | -14.1 | -14.1 | -14.1 | -14.1 | -14.1 |
| Depreciation | 69.8 | 101.6 | 151.4 | 201.4 | 203.5 | 440.1 | 659.1 | 987.1 | 1,478.3 | 2,214.0 |
| Depreciation, % | 9.3 | 9.34 | 8.59 | 6.95 | 5.49 | 7.93 | 7.93 | 7.93 | 7.93 | 7.93 |
| EBIT | -328.5 | -481.2 | -318.7 | -301.2 | 233.3 | -1,222.0 | -1,830.1 | -2,740.9 | -4,105.0 | -6,147.9 |
| EBIT, % | -43.74 | -44.24 | -18.08 | -10.39 | 6.3 | -22.03 | -22.03 | -22.03 | -22.03 | -22.03 |
| Total Cash | 872.6 | 689.6 | 1,461.3 | 3,586.0 | 4,342.3 | 4,951.2 | 7,415.2 | 11,105.5 | 16,632.4 | 24,909.9 |
| Total Cash, percent | .0 | .0 | .0 | .0 | .0 | .0 | .0 | .0 | .0 | .0 |
| Account Receivables | 17.9 | 85.5 | 127.1 | 169.9 | 587.5 | 434.7 | 651.0 | 975.0 | 1,460.2 | 2,186.8 |
| Account Receivables, % | 2.39 | 7.86 | 7.21 | 5.86 | 15.86 | 7.84 | 7.84 | 7.84 | 7.84 | 7.84 |
| Inventories | .0 | .0 | .0 | .0 | .0 | .0 | .0 | .0 | .0 | .0 |
| Inventories, % | 0 | 0 | 0 | 0 | 0 | 0 | 0 | 0 | 0 | 0 |
| Accounts Payable | 452.9 | 158.1 | 144.6 | 159.9 | 132.8 | 1,022.1 | 1,530.8 | 2,292.6 | 3,433.6 | 5,142.4 |
| Accounts Payable, % | 60.3 | 14.53 | 8.2 | 5.52 | 3.59 | 18.43 | 18.43 | 18.43 | 18.43 | 18.43 |
| Capital Expenditure | -24.5 | -52.3 | -103.7 | -121.2 | -163.6 | -250.3 | -374.8 | -561.3 | -840.7 | -1,259.0 |
| Capital Expenditure, % | -3.27 | -4.8 | -5.88 | -4.18 | -4.42 | -4.51 | -4.51 | -4.51 | -4.51 | -4.51 |
| Tax Rate, % | -113.7 | -113.7 | -113.7 | -113.7 | -113.7 | -113.7 | -113.7 | -113.7 | -113.7 | -113.7 |
| EBITAT | -224.1 | -483.9 | -320.4 | -300.7 | 498.7 | -1,143.9 | -1,713.2 | -2,565.8 | -3,842.8 | -5,755.2 |
| Depreciation | ||||||||||
| Changes in Account Receivables | ||||||||||
| Changes in Inventories | ||||||||||
| Changes in Accounts Payable | ||||||||||
| Capital Expenditure | ||||||||||
| UFCF | 256.2 | -797.1 | -327.8 | -248.0 | 93.8 | 88.0 | -1,136.6 | -1,702.2 | -2,549.4 | -3,818.2 |
| WACC, % | 13.87 | 14.9 | 14.9 | 14.89 | 14.9 | 14.69 | 14.69 | 14.69 | 14.69 | 14.69 |
| PV UFCF | ||||||||||
| SUM PV UFCF | -5,313.2 | |||||||||
| Long Term Growth Rate, % | 2.00 | |||||||||
| Free cash flow (T + 1) | -3,895 | |||||||||
| Terminal Value | -30,689 | |||||||||
| Present Terminal Value | -15,465 | |||||||||
| Enterprise Value | -20,779 | |||||||||
| Net Debt | 666 | |||||||||
| Equity Value | -21,444 | |||||||||
| Diluted Shares Outstanding, MM | 1,101 | |||||||||
| Equity Value Per Share | -19.47 |
What You Will Get
- Real SOFI Financials: Includes historical and forecasted data for precise valuation.
- Adjustable Inputs: Customize WACC, tax rates, revenue growth, and capital expenditures.
- Automatic Calculations: Intrinsic value and NPV are computed dynamically.
- Scenario Analysis: Evaluate various scenarios to assess SoFi's future performance.
- Clear and Intuitive Design: Designed for professionals while remaining user-friendly for beginners.
Key Features
- Real-Life SOFI Data: Pre-filled with SoFi Technologies’ historical financials and future growth projections.
- Fully Customizable Inputs: Modify revenue growth rates, profit margins, WACC, tax rates, and capital expenditures.
- Dynamic Valuation Model: Automatic updates to Net Present Value (NPV) and intrinsic value based on your inputs.
- Scenario Testing: Develop multiple forecasting scenarios to evaluate different valuation results.
- User-Friendly Design: Intuitive, organized, and tailored for both professionals and novices.
How It Works
- Step 1: Download the Excel file.
- Step 2: Review SoFi Technologies, Inc.'s (SOFI) pre-filled financial data and forecasts.
- Step 3: Modify key inputs such as revenue growth, WACC, and tax rates (highlighted cells).
- Step 4: Watch the DCF model update in real-time as you adjust assumptions.
- Step 5: Analyze the outputs and leverage the results for your investment decisions.
Why Choose SoFi Technologies, Inc. (SOFI)?
- Streamlined Experience: Access a comprehensive platform without the hassle of complex setups.
- Enhanced Accuracy: Utilize dependable financial tools and data to minimize valuation errors.
- Fully Adaptable: Customize features to align with your financial strategies and goals.
- User-Friendly Interface: Intuitive designs and visuals make it simple to understand your financial insights.
- Endorsed by Professionals: Built for users who prioritize accuracy and a seamless experience.
Who Should Use This Product?
- Investors: Accurately estimate SoFi Technologies, Inc.'s (SOFI) fair value before making investment decisions.
- CFOs: Utilize a professional-grade DCF model for financial reporting and analysis specific to SoFi Technologies, Inc. (SOFI).
- Consultants: Quickly adapt the template for valuation reports tailored for clients focusing on SoFi Technologies, Inc. (SOFI).
- Entrepreneurs: Gain insights into financial modeling practices employed by leading fintech companies like SoFi Technologies, Inc. (SOFI).
- Educators: Use it as a teaching tool to illustrate valuation methodologies relevant to SoFi Technologies, Inc. (SOFI).
What the Template Contains
- Historical Data: Includes SoFi’s past financials and baseline forecasts.
- DCF and Levered DCF Models: Detailed templates to calculate SoFi’s intrinsic value.
- WACC Sheet: Pre-built calculations for Weighted Average Cost of Capital.
- Editable Inputs: Modify key drivers like growth rates, EBITDA %, and CAPEX assumptions.
- Quarterly and Annual Statements: A complete breakdown of SoFi’s financials.
- Interactive Dashboard: Visualize valuation results and projections dynamically.
Disclaimer
All information, articles, and product details provided on this website are for general informational and educational purposes only. We do not claim any ownership over, nor do we intend to infringe upon, any trademarks, copyrights, logos, brand names, or other intellectual property mentioned or depicted on this site. Such intellectual property remains the property of its respective owners, and any references here are made solely for identification or informational purposes, without implying any affiliation, endorsement, or partnership.
We make no representations or warranties, express or implied, regarding the accuracy, completeness, or suitability of any content or products presented. Nothing on this website should be construed as legal, tax, investment, financial, medical, or other professional advice. In addition, no part of this site—including articles or product references—constitutes a solicitation, recommendation, endorsement, advertisement, or offer to buy or sell any securities, franchises, or other financial instruments, particularly in jurisdictions where such activity would be unlawful.
All content is of a general nature and may not address the specific circumstances of any individual or entity. It is not a substitute for professional advice or services. Any actions you take based on the information provided here are strictly at your own risk. You accept full responsibility for any decisions or outcomes arising from your use of this website and agree to release us from any liability in connection with your use of, or reliance upon, the content or products found herein.