
|
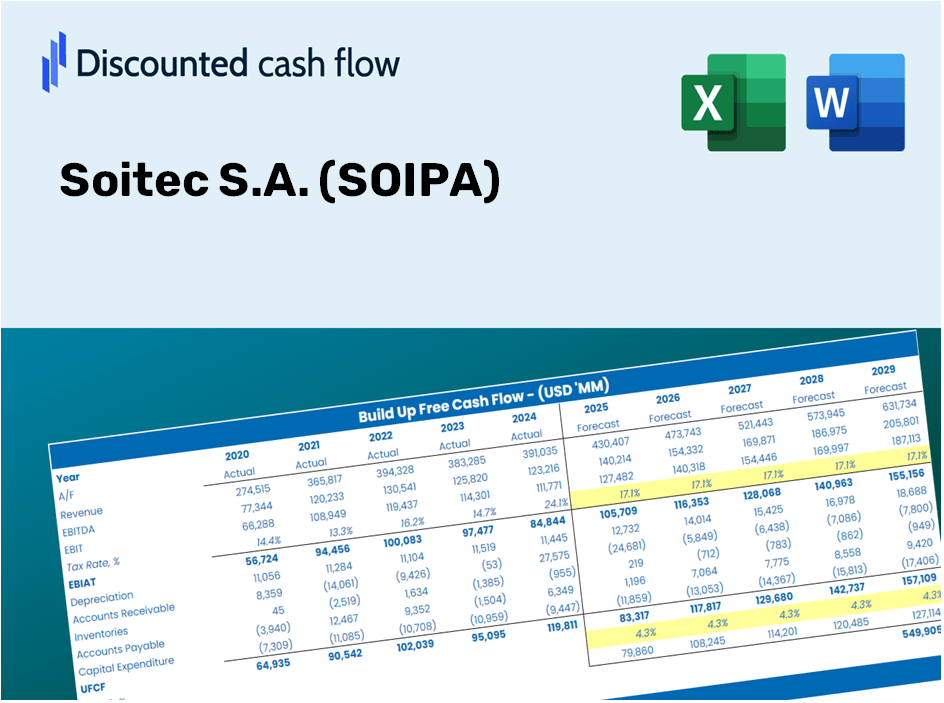
Soitec S.A. (Soi.Pa) Valation DCF |
Entièrement Modifiable: Adapté À Vos Besoins Dans Excel Ou Sheets
Conception Professionnelle: Modèles Fiables Et Conformes Aux Normes Du Secteur
Pré-Construits Pour Une Utilisation Rapide Et Efficace
Compatible MAC/PC, entièrement débloqué
Aucune Expertise N'Est Requise; Facile À Suivre
Soitec S.A. (SOI.PA) Bundle
Évaluez les perspectives financières de Soitec S.A comme un expert! Cette calculatrice DCF (SOIPA) fournit des données financières pré-remplies et offre une flexibilité totale pour modifier la croissance des revenus, le WACC, les marges et d'autres hypothèses cruciales pour correspondre à vos projections.
Benefits You Will Receive
- Accurate SOIPA Financial Data: Pre-loaded with Soitec S.A.'s historical and projected figures for thorough analysis.
- Fully Customizable Template: Easily adjust crucial inputs such as revenue growth, WACC, and EBITDA percentage.
- Real-Time Calculations: Instantly view updates to Soitec S.A.'s intrinsic value based on your modifications.
- Professional Valuation Tool: Tailored for investors, analysts, and consultants in pursuit of precise DCF results.
- User-Friendly Interface: Simplistic layout and straightforward instructions suitable for all skill levels.
Key Features
- Customizable Forecast Inputs: Adjust essential parameters such as revenue growth, EBITDA %, and capital expenditures.
- Instant DCF Valuation: Automatically computes intrinsic value, NPV, and other financial metrics in real time.
- High-Precision Accuracy: Leverages Soitec S.A.'s (SOIPA) actual financial data for reliable valuation results.
- Seamless Scenario Analysis: Easily evaluate various assumptions and compare results side by side.
- Efficiency Booster: Streamlines the valuation process, eliminating the need for intricate models from the ground up.
How It Functions
- Step 1: Download the Excel spreadsheet.
- Step 2: Examine the pre-filled Soitec S.A. (SOIPA) data (both historical and projected).
- Step 3: Modify key assumptions (highlighted in yellow) according to your analysis.
- Step 4: Observe automatic recalculations for Soitec S.A.'s intrinsic value.
- Step 5: Utilize the results for your investment strategies or reporting needs.
Why Choose Soitec S.A. (SOIPA) Calculator?
- Time Efficient: You won’t have to build a DCF model from the ground up – it’s ready for immediate use.
- Enhanced Accuracy: Dependable financial data and proven formulas minimize valuation errors.
- Completely Customizable: Adjust the model to align with your specific assumptions and forecasts.
- User-Friendly: Intuitive charts and outputs simplify the analysis of results.
- Endorsed by Professionals: Crafted for experts who prioritize precision and ease of use.
Who Can Benefit from This Product?
- Institutional Investors: Develop comprehensive and dependable valuation models for their investment portfolios.
- Corporate Finance Departments: Evaluate valuation scenarios to inform strategic decision-making.
- Consultants and Financial Advisors: Equip clients with precise valuation insights for Soitec S.A. (SOIPA) stock.
- Academics and Students: Utilize real-world data for hands-on experience in financial modeling and education.
- Technology Aficionados: Gain insights into how companies like Soitec S.A. (SOIPA) are assessed in the financial markets.
What the Template Includes
- Preloaded SOIPA Data: Historical and projected financial information, encompassing revenue, EBIT, and capital expenditures.
- DCF and WACC Models: Advanced sheets for determining intrinsic value and Weighted Average Cost of Capital.
- Editable Inputs: Yellow-highlighted fields for customizing revenue growth, tax rates, and discount rates.
- Financial Statements: Detailed annual and quarterly financials for in-depth analysis.
- Key Ratios: Profitability, leverage, and efficiency ratios for performance assessment.
- Dashboard and Charts: Visual representations of valuation results and assumptions.
Disclaimer
All information, articles, and product details provided on this website are for general informational and educational purposes only. We do not claim any ownership over, nor do we intend to infringe upon, any trademarks, copyrights, logos, brand names, or other intellectual property mentioned or depicted on this site. Such intellectual property remains the property of its respective owners, and any references here are made solely for identification or informational purposes, without implying any affiliation, endorsement, or partnership.
We make no representations or warranties, express or implied, regarding the accuracy, completeness, or suitability of any content or products presented. Nothing on this website should be construed as legal, tax, investment, financial, medical, or other professional advice. In addition, no part of this site—including articles or product references—constitutes a solicitation, recommendation, endorsement, advertisement, or offer to buy or sell any securities, franchises, or other financial instruments, particularly in jurisdictions where such activity would be unlawful.
All content is of a general nature and may not address the specific circumstances of any individual or entity. It is not a substitute for professional advice or services. Any actions you take based on the information provided here are strictly at your own risk. You accept full responsibility for any decisions or outcomes arising from your use of this website and agree to release us from any liability in connection with your use of, or reliance upon, the content or products found herein.