
|
Solvay SA (Solb.Br) Valation DCF |
Entièrement Modifiable: Adapté À Vos Besoins Dans Excel Ou Sheets
Conception Professionnelle: Modèles Fiables Et Conformes Aux Normes Du Secteur
Pré-Construits Pour Une Utilisation Rapide Et Efficace
Compatible MAC/PC, entièrement débloqué
Aucune Expertise N'Est Requise; Facile À Suivre
Solvay SA (SOLB.BR) Bundle
Améliorez votre stratégie d'investissement avec la calculatrice DCF Solvay SA (SOLBBR)! Utilisez des données financières authentiques, modifiez les prévisions et les dépenses de croissance et observez comment ces ajustements influencent la valeur intrinsèque de Solvay SA en temps réel.
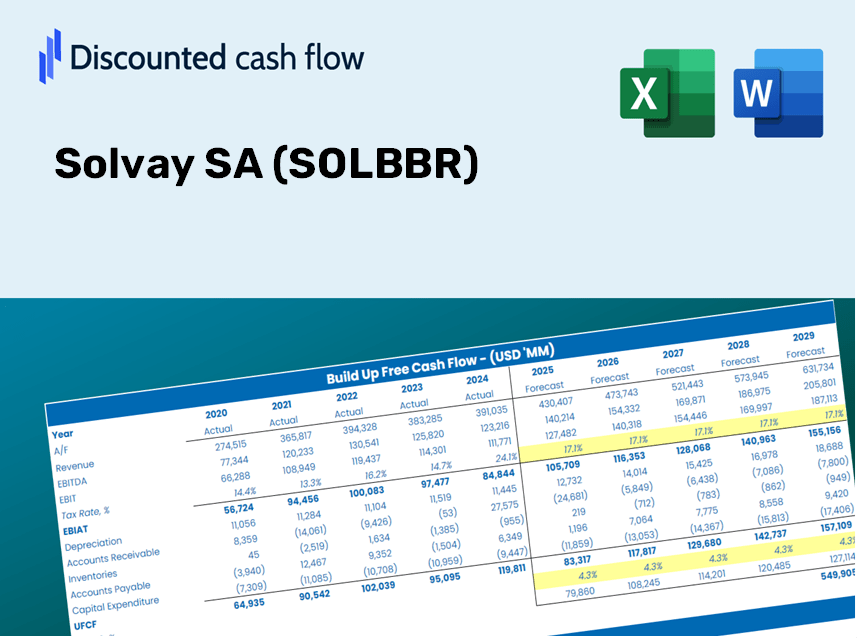
Discounted Cash Flow (DCF) - (USD MM)
| Year | AY1 2020 |
AY2 2021 |
AY3 2022 |
AY4 2023 |
AY5 2024 |
FY1 2025 |
FY2 2026 |
FY3 2027 |
FY4 2028 |
FY5 2029 |
|---|---|---|---|---|---|---|---|---|---|---|
| Revenue | 9,714.0 | 11,435.0 | 16,071.0 | 6,024.0 | 5,130.0 | 4,813.6 | 4,516.7 | 4,238.1 | 3,976.7 | 3,731.4 |
| Revenue Growth, % | 0 | 17.72 | 40.54 | -62.52 | -14.84 | -6.17 | -6.17 | -6.17 | -6.17 | -6.17 |
| EBITDA | 1,754.0 | 1,949.0 | 1,362.0 | 526.0 | 805.0 | 654.6 | 614.3 | 576.4 | 540.8 | 507.5 |
| EBITDA, % | 18.06 | 17.04 | 8.47 | 8.73 | 15.69 | 13.6 | 13.6 | 13.6 | 13.6 | 13.6 |
| Depreciation | 1,016.0 | 906.0 | 329.0 | 328.0 | 362.0 | 317.0 | 297.5 | 279.1 | 261.9 | 245.8 |
| Depreciation, % | 10.46 | 7.92 | 2.05 | 5.44 | 7.06 | 6.59 | 6.59 | 6.59 | 6.59 | 6.59 |
| EBIT | 738.0 | 1,043.0 | 1,033.0 | 198.0 | 443.0 | 337.6 | 316.8 | 297.2 | 278.9 | 261.7 |
| EBIT, % | 7.6 | 9.12 | 6.43 | 3.29 | 8.64 | 7.01 | 7.01 | 7.01 | 7.01 | 7.01 |
| Total Cash | 1,219.0 | 2,267.0 | 1,690.0 | 711.0 | 555.0 | 630.7 | 591.8 | 555.3 | 521.0 | 488.9 |
| Total Cash, percent | .0 | .0 | .0 | .0 | .0 | .0 | .0 | .0 | .0 | .0 |
| Account Receivables | 1,386.0 | 1,805.0 | 2,179.0 | 1,008.0 | 1,242.0 | 814.0 | 763.8 | 716.7 | 672.5 | 631.0 |
| Account Receivables, % | 14.27 | 15.78 | 13.56 | 16.73 | 24.21 | 16.91 | 16.91 | 16.91 | 16.91 | 16.91 |
| Inventories | 1,241.0 | 1,745.0 | 2,109.0 | 642.0 | 623.0 | 615.8 | 577.8 | 542.1 | 508.7 | 477.3 |
| Inventories, % | 12.78 | 15.26 | 13.12 | 10.66 | 12.14 | 12.79 | 12.79 | 12.79 | 12.79 | 12.79 |
| Accounts Payable | 1,197.0 | 2,131.0 | 2,296.0 | 850.0 | 810.0 | 723.4 | 678.8 | 636.9 | 597.7 | 560.8 |
| Accounts Payable, % | 12.32 | 18.64 | 14.29 | 14.11 | 15.79 | 15.03 | 15.03 | 15.03 | 15.03 | 15.03 |
| Capital Expenditure | -535.0 | -636.0 | -909.0 | -1,064.0 | -285.0 | -384.5 | -360.8 | -338.6 | -317.7 | -298.1 |
| Capital Expenditure, % | -5.51 | -5.56 | -5.66 | -17.66 | -5.56 | -7.99 | -7.99 | -7.99 | -7.99 | -7.99 |
| Tax Rate, % | 30.31 | 30.31 | 30.31 | 30.31 | 30.31 | 30.31 | 30.31 | 30.31 | 30.31 | 30.31 |
| EBITAT | 954.9 | 903.8 | 914.9 | 2,302.3 | 308.7 | 300.4 | 281.9 | 264.5 | 248.2 | 232.9 |
| Depreciation | ||||||||||
| Changes in Account Receivables | ||||||||||
| Changes in Inventories | ||||||||||
| Changes in Accounts Payable | ||||||||||
| Capital Expenditure | ||||||||||
| UFCF | 5.9 | 1,184.8 | -238.1 | 2,758.3 | 130.7 | 581.5 | 262.1 | 245.9 | 230.8 | 216.5 |
| WACC, % | 5 | 4.71 | 4.75 | 5 | 4.35 | 4.76 | 4.76 | 4.76 | 4.76 | 4.76 |
| PV UFCF | ||||||||||
| SUM PV UFCF | 1,371.0 | |||||||||
| Long Term Growth Rate, % | 1.00 | |||||||||
| Free cash flow (T + 1) | 219 | |||||||||
| Terminal Value | 5,813 | |||||||||
| Present Terminal Value | 4,607 | |||||||||
| Enterprise Value | 5,978 | |||||||||
| Net Debt | 1,599 | |||||||||
| Equity Value | 4,379 | |||||||||
| Diluted Shares Outstanding, MM | 106 | |||||||||
| Equity Value Per Share | 41.29 |
What You Will Receive
- Editable Excel Template: A fully customizable Excel-based DCF Calculator featuring pre-filled financial data for Solvay SA (SOLBBR).
- Real-World Data: Access to historical performance metrics and forward-looking projections (highlighted in the yellow cells).
- Forecast Flexibility: Adjust forecast parameters such as revenue growth, EBITDA %, and WACC as needed.
- Automatic Calculations: Instantly observe how your inputs influence the valuation of Solvay SA (SOLBBR).
- Professional Tool: Designed for investors, CFOs, consultants, and financial analysts alike.
- User-Friendly Design: Organized for clarity and ease of navigation, complete with step-by-step guidance.
Key Features
- Advanced DCF Calculator: Features comprehensive unlevered and levered DCF valuation models tailored for Solvay SA (SOLBBR).
- WACC Calculator: Ready-to-use Weighted Average Cost of Capital sheet with adjustable inputs specific to Solvay SA (SOLBBR).
- Customizable Forecast Assumptions: Easily adjust growth rates, capital expenses, and discount rates for accurate projections related to Solvay SA (SOLBBR).
- Integrated Financial Ratios: Evaluate profitability, leverage, and efficiency ratios relevant to Solvay SA (SOLBBR).
- Interactive Dashboard and Charts: Visual representations provide a summary of essential valuation metrics for quick analysis of Solvay SA (SOLBBR).
How It Functions
- 1. Access the Template: Download and open the Excel file containing Solvay SA’s (SOLBBR) preloaded data.
- 2. Modify Assumptions: Update key variables such as growth rates, WACC, and capital expenditure estimates.
- 3. View Results Immediately: The DCF model automatically computes intrinsic value and NPV.
- 4. Explore Scenarios: Analyze various projections to evaluate different valuation possibilities.
- 5. Utilize with Assurance: Present professional valuation insights to back your strategic decisions.
Why Opt for This Calculator?
- Precise Information: Authentic Solvay SA (SOLBBR) financial data guarantees dependable valuation outcomes.
- Customizable Features: Tailor essential inputs such as growth rates, WACC, and tax rates to suit your forecasts.
- Efficient: Built-in calculations save you the hassle of creating models from the ground up.
- Professional-Quality Tool: Tailored for investors, analysts, and consultants focused on Solvay SA (SOLBBR).
- User-Friendly Interface: An intuitive design with clear, step-by-step guidance simplifies the process for everyone.
Who Should Use This Product?
- Individual Investors: Make educated choices regarding the purchase or sale of Solvay SA (SOLBBR) stock.
- Financial Analysts: Enhance valuation processes with accessible financial models tailored for Solvay SA (SOLBBR).
- Consultants: Provide clients with quick and precise valuation insights related to Solvay SA (SOLBBR).
- Business Owners: Gain insights into the valuation of major companies like Solvay SA (SOLBBR) to inform your own business strategies.
- Finance Students: Apply valuation techniques using real-world data and case studies involving Solvay SA (SOLBBR).
Contents of the Template
- Pre-Filled DCF Model: Solvay SA’s financial data preloaded for immediate application.
- WACC Calculator: Comprehensive calculations for the Weighted Average Cost of Capital.
- Financial Ratios: Assess Solvay SA's (SOLBBR) profitability, leverage, and efficiency.
- Editable Inputs: Modify assumptions such as growth rates, profit margins, and CAPEX to suit your scenarios.
- Financial Statements: Annual and quarterly reports to facilitate in-depth analysis.
- Interactive Dashboard: Effortlessly visualize essential valuation metrics and outcomes.
Disclaimer
All information, articles, and product details provided on this website are for general informational and educational purposes only. We do not claim any ownership over, nor do we intend to infringe upon, any trademarks, copyrights, logos, brand names, or other intellectual property mentioned or depicted on this site. Such intellectual property remains the property of its respective owners, and any references here are made solely for identification or informational purposes, without implying any affiliation, endorsement, or partnership.
We make no representations or warranties, express or implied, regarding the accuracy, completeness, or suitability of any content or products presented. Nothing on this website should be construed as legal, tax, investment, financial, medical, or other professional advice. In addition, no part of this site—including articles or product references—constitutes a solicitation, recommendation, endorsement, advertisement, or offer to buy or sell any securities, franchises, or other financial instruments, particularly in jurisdictions where such activity would be unlawful.
All content is of a general nature and may not address the specific circumstances of any individual or entity. It is not a substitute for professional advice or services. Any actions you take based on the information provided here are strictly at your own risk. You accept full responsibility for any decisions or outcomes arising from your use of this website and agree to release us from any liability in connection with your use of, or reliance upon, the content or products found herein.