
|
SPIE SA (SPIE.PA) Évaluation DCF |
Entièrement Modifiable: Adapté À Vos Besoins Dans Excel Ou Sheets
Conception Professionnelle: Modèles Fiables Et Conformes Aux Normes Du Secteur
Pré-Construits Pour Une Utilisation Rapide Et Efficace
Compatible MAC/PC, entièrement débloqué
Aucune Expertise N'Est Requise; Facile À Suivre
SPIE SA (SPIE.PA) Bundle
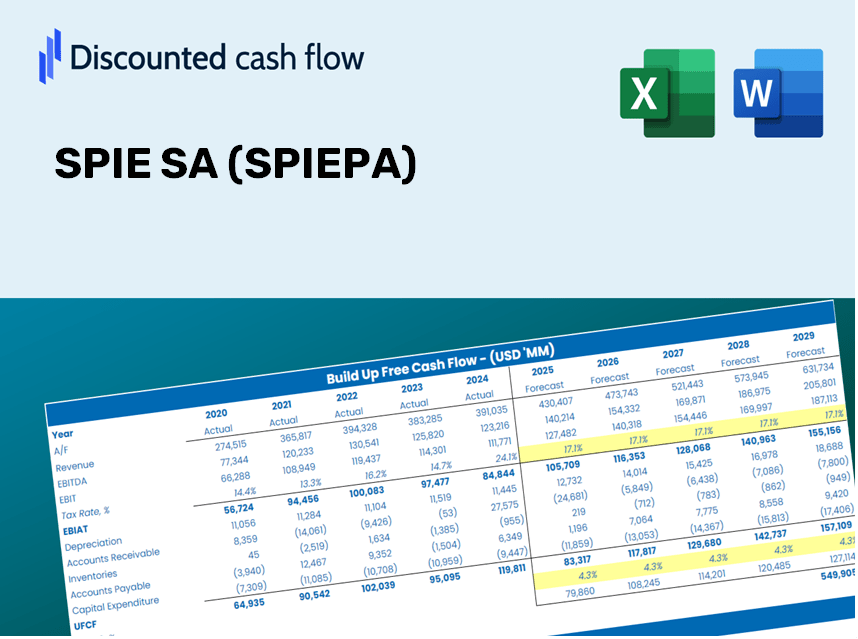
Gardez un aperçu de votre analyse d'évaluation SPIE SA (SPIEPA) avec notre calculatrice sophistiquée DCF! Déjà équipé de données SPIEPA réelles, ce modèle Excel vous permet d'ajuster les prévisions et les hypothèses pour déterminer avec précision la valeur intrinsèque de SPIE SA.
What You Will Receive
- Pre-Filled Financial Model: Utilizing SPIE SA's (SPIEPA) actual data for accurate DCF valuation.
- Comprehensive Forecast Control: Modify revenue growth, profit margins, WACC, and other critical drivers.
- Instant Calculations: Real-time updates to display results as changes are made.
- Investor-Ready Template: A polished Excel file crafted for high-quality valuation.
- Customizable and Reusable: Designed for adaptability, facilitating repeated use for in-depth forecasts.
Key Features
- Comprehensive DCF Calculator: Features detailed unlevered and levered DCF valuation frameworks.
- WACC Calculator: Pre-defined Weighted Average Cost of Capital sheet with adjustable parameters.
- Editable Forecast Assumptions: Adjust growth projections, capital expenditures, and discount rates as needed.
- Integrated Financial Ratios: Evaluate profitability, leverage, and efficiency ratios for SPIE SA (SPIEPA).
- Interactive Dashboard and Charts: Visual representations highlight key valuation metrics for simplified analysis.
How It Works
- Step 1: Download the Excel file.
- Step 2: Review the pre-filled SPIE SA (SPIEPA) data (historical and projected).
- Step 3: Modify the key assumptions (yellow cells) according to your analysis.
- Step 4: Observe the automatic recalculations for SPIE SA's intrinsic value.
- Step 5: Utilize the outputs for your investment decisions or reporting needs.
Why Opt for This Calculator?
- User-Friendly: Tailored for both novices and seasoned professionals.
- Customizable Inputs: Effortlessly adjust parameters to suit your analysis needs.
- Immediate Feedback: Observe real-time updates to SPIE SA's (SPIEPA) valuation as you modify inputs.
- Preconfigured Data: Comes with SPIE SA's (SPIEPA) actual financial information for swift assessments.
- Preferred by Experts: Favored by investors and analysts for making well-informed choices.
Who Should Use This Product?
- Professional Investors: Develop comprehensive and dependable valuation models for portfolio evaluation.
- Corporate Finance Teams: Assess valuation scenarios to inform internal decision-making.
- Consultants and Advisors: Deliver precise valuation insights related to SPIE SA (SPIEPA) for clients.
- Students and Educators: Utilize real-world data to enhance financial modeling skills and instruction.
- Industry Enthusiasts: Gain insights into how companies like SPIE SA (SPIEPA) are valued in the market.
Contents of the Template
- Pre-Filled Data: Features historical financial data and forecasts for SPIE SA (SPIEPA).
- Discounted Cash Flow Model: An editable DCF valuation model with automated calculations.
- Weighted Average Cost of Capital (WACC): A specific sheet for calculating WACC using customized inputs.
- Key Financial Ratios: Evaluate SPIE SA's (SPIEPA) profitability, efficiency, and leverage.
- Customizable Inputs: Easily adjust revenue growth, profit margins, and tax rates.
- Clear Dashboard: Visual representations and tables summarizing essential valuation outcomes.
Disclaimer
All information, articles, and product details provided on this website are for general informational and educational purposes only. We do not claim any ownership over, nor do we intend to infringe upon, any trademarks, copyrights, logos, brand names, or other intellectual property mentioned or depicted on this site. Such intellectual property remains the property of its respective owners, and any references here are made solely for identification or informational purposes, without implying any affiliation, endorsement, or partnership.
We make no representations or warranties, express or implied, regarding the accuracy, completeness, or suitability of any content or products presented. Nothing on this website should be construed as legal, tax, investment, financial, medical, or other professional advice. In addition, no part of this site—including articles or product references—constitutes a solicitation, recommendation, endorsement, advertisement, or offer to buy or sell any securities, franchises, or other financial instruments, particularly in jurisdictions where such activity would be unlawful.
All content is of a general nature and may not address the specific circumstances of any individual or entity. It is not a substitute for professional advice or services. Any actions you take based on the information provided here are strictly at your own risk. You accept full responsibility for any decisions or outcomes arising from your use of this website and agree to release us from any liability in connection with your use of, or reliance upon, the content or products found herein.