|
SAPIENS International Corporation N.V. (SPNS) Valation DCF |
Entièrement Modifiable: Adapté À Vos Besoins Dans Excel Ou Sheets
Conception Professionnelle: Modèles Fiables Et Conformes Aux Normes Du Secteur
Pré-Construits Pour Une Utilisation Rapide Et Efficace
Compatible MAC/PC, entièrement débloqué
Aucune Expertise N'Est Requise; Facile À Suivre
Sapiens International Corporation N.V. (SPNS) Bundle
Découvrez la vraie valeur de Sapiens International Corporation N.V. (SPNS) avec notre calculatrice DCF de qualité professionnelle! Ajustez les hypothèses clés, explorez divers scénarios et évaluez comment les changements affectent l'évaluation de Sapiens International Corporation N.V. (SPNS) - le tout dans un modèle Excel pratique.
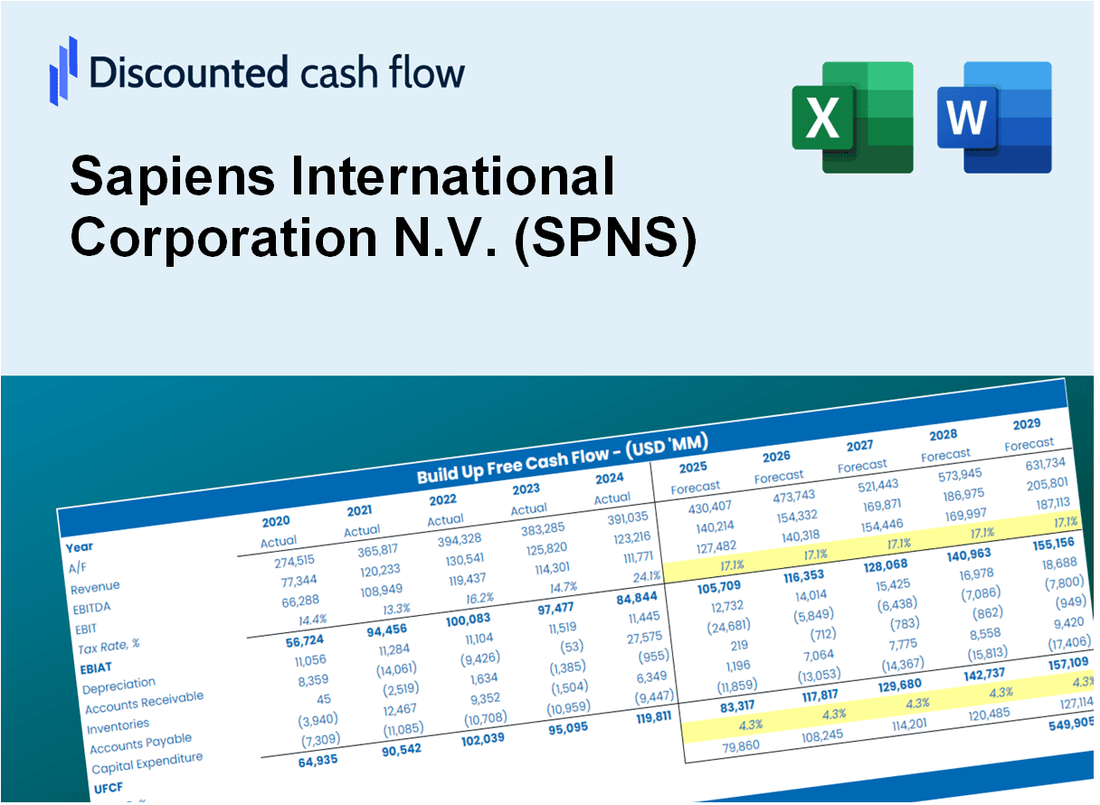
Discounted Cash Flow (DCF) - (USD MM)
| Year | AY1 2020 |
AY2 2021 |
AY3 2022 |
AY4 2023 |
AY5 2024 |
FY1 2025 |
FY2 2026 |
FY3 2027 |
FY4 2028 |
FY5 2029 |
|---|---|---|---|---|---|---|---|---|---|---|
| Revenue | 382.9 | 461.0 | 474.7 | 514.6 | 542.4 | 592.8 | 647.9 | 708.1 | 773.9 | 845.8 |
| Revenue Growth, % | 0 | 20.41 | 2.97 | 8.39 | 5.4 | 9.29 | 9.29 | 9.29 | 9.29 | 9.29 |
| EBITDA | 63.4 | 84.1 | 82.9 | 94.9 | 105.9 | 107.0 | 116.9 | 127.8 | 139.7 | 152.6 |
| EBITDA, % | 16.56 | 18.25 | 17.46 | 18.43 | 19.53 | 18.05 | 18.05 | 18.05 | 18.05 | 18.05 |
| Depreciation | 16.8 | 21.0 | 16.4 | 15.7 | 20.1 | 22.7 | 24.8 | 27.1 | 29.6 | 32.4 |
| Depreciation, % | 4.39 | 4.55 | 3.45 | 3.04 | 3.7 | 3.83 | 3.83 | 3.83 | 3.83 | 3.83 |
| EBIT | 46.6 | 63.1 | 66.5 | 79.2 | 85.8 | 84.3 | 92.1 | 100.7 | 110.0 | 120.2 |
| EBIT, % | 12.17 | 13.69 | 14.01 | 15.39 | 15.83 | 14.22 | 14.22 | 14.22 | 14.22 | 14.22 |
| Total Cash | 182.6 | 210.2 | 180.3 | 202.1 | 216.2 | 249.4 | 272.6 | 297.9 | 325.6 | 355.9 |
| Total Cash, percent | .0 | .0 | .0 | .0 | .0 | .0 | .0 | .0 | .0 | .0 |
| Account Receivables | 65.4 | 76.3 | 93.4 | 90.3 | 99.6 | 105.8 | 115.6 | 126.3 | 138.1 | 150.9 |
| Account Receivables, % | 17.08 | 16.54 | 19.67 | 17.54 | 18.36 | 17.84 | 17.84 | 17.84 | 17.84 | 17.84 |
| Inventories | .0 | -13.8 | .0 | .0 | .0 | -3.6 | -3.9 | -4.3 | -4.6 | -5.1 |
| Inventories, % | 0 | -3 | 0 | 0 | 0 | -0.60043 | -0.60043 | -0.60043 | -0.60043 | -0.60043 |
| Accounts Payable | 5.4 | 5.0 | 9.4 | 6.3 | 8.4 | 8.6 | 9.4 | 10.3 | 11.2 | 12.3 |
| Accounts Payable, % | 1.41 | 1.09 | 1.98 | 1.22 | 1.55 | 1.45 | 1.45 | 1.45 | 1.45 | 1.45 |
| Capital Expenditure | -11.2 | -11.8 | -9.1 | -9.3 | -10.0 | -13.1 | -14.3 | -15.7 | -17.1 | -18.7 |
| Capital Expenditure, % | -2.94 | -2.57 | -1.91 | -1.8 | -1.85 | -2.21 | -2.21 | -2.21 | -2.21 | -2.21 |
| Tax Rate, % | 19.65 | 19.65 | 19.65 | 19.65 | 19.65 | 19.65 | 19.65 | 19.65 | 19.65 | 19.65 |
| EBITAT | 38.2 | 52.0 | 53.4 | 64.1 | 69.0 | 68.4 | 74.8 | 81.7 | 89.3 | 97.6 |
| Depreciation | ||||||||||
| Changes in Account Receivables | ||||||||||
| Changes in Inventories | ||||||||||
| Changes in Accounts Payable | ||||||||||
| Capital Expenditure | ||||||||||
| UFCF | -16.2 | 63.7 | 34.1 | 70.5 | 71.8 | 75.6 | 76.5 | 83.7 | 91.4 | 99.9 |
| WACC, % | 7.87 | 7.87 | 7.86 | 7.87 | 7.86 | 7.87 | 7.87 | 7.87 | 7.87 | 7.87 |
| PV UFCF | ||||||||||
| SUM PV UFCF | 338.5 | |||||||||
| Long Term Growth Rate, % | 3.50 | |||||||||
| Free cash flow (T + 1) | 103 | |||||||||
| Terminal Value | 2,369 | |||||||||
| Present Terminal Value | 1,622 | |||||||||
| Enterprise Value | 1,961 | |||||||||
| Net Debt | -100 | |||||||||
| Equity Value | 2,061 | |||||||||
| Diluted Shares Outstanding, MM | 56 | |||||||||
| Equity Value Per Share | 36.70 |
What You Will Get
- Comprehensive SPNS Financials: Access to historical and projected data for precise valuation.
- Customizable Inputs: Adjust WACC, tax rates, revenue growth, and capital expenditures as needed.
- Real-Time Calculations: Intrinsic value and NPV are computed automatically.
- Scenario Analysis: Evaluate various scenarios to assess Sapiens International’s future performance.
- User-Friendly Interface: Designed for industry professionals while remaining approachable for newcomers.
Key Features
- Comprehensive DCF Calculator: Offers both unlevered and levered DCF valuation models tailored for Sapiens International Corporation N.V. (SPNS).
- WACC Calculator: Features a pre-configured Weighted Average Cost of Capital sheet with options for user-defined inputs.
- Customizable Forecast Assumptions: Adjust growth rates, capital expenditures, and discount rates to fit your analysis.
- Integrated Financial Ratios: Evaluate profitability, leverage, and efficiency ratios specifically for Sapiens International Corporation N.V. (SPNS).
- Interactive Dashboard and Charts: Visual representations of essential valuation metrics for straightforward analysis.
How It Works
- Download the Template: Gain immediate access to the Excel-based SPNS DCF Calculator.
- Input Your Assumptions: Modify the yellow-highlighted cells for growth rates, WACC, margins, and additional parameters.
- Instant Calculations: The model will automatically refresh Sapiens International Corporation’s intrinsic value.
- Test Scenarios: Experiment with various assumptions to assess potential changes in valuation.
- Analyze and Decide: Utilize the results to inform your investment or financial analysis.
Why Choose This Calculator for Sapiens International Corporation N.V. (SPNS)?
- User-Friendly Interface: Tailored for both novices and seasoned professionals.
- Customizable Inputs: Adjust parameters easily to suit your financial analysis.
- Real-Time Valuation: Witness immediate updates to Sapiens’ valuation as you tweak inputs.
- Pre-Loaded Data: Comes with Sapiens’ actual financial figures for swift evaluations.
- Relied Upon by Experts: Favored by investors and analysts for making well-informed choices.
Who Should Use This Product?
- Investors: Accurately assess Sapiens International Corporation N.V.’s (SPNS) fair value prior to making investment choices.
- CFOs: Utilize a professional-grade DCF model for comprehensive financial reporting and analysis.
- Consultants: Efficiently customize the template for client valuation reports.
- Entrepreneurs: Acquire insights into financial modeling practices employed by leading companies.
- Educators: Implement it as a teaching resource to illustrate valuation methodologies.
What the Template Contains
- Historical Data: Includes Sapiens International Corporation N.V.’s (SPNS) past financials and baseline forecasts.
- DCF and Levered DCF Models: Detailed templates to calculate Sapiens International Corporation N.V.’s (SPNS) intrinsic value.
- WACC Sheet: Pre-built calculations for Weighted Average Cost of Capital.
- Editable Inputs: Modify key drivers like growth rates, EBITDA %, and CAPEX assumptions.
- Quarterly and Annual Statements: A complete breakdown of Sapiens International Corporation N.V.’s (SPNS) financials.
- Interactive Dashboard: Visualize valuation results and projections dynamically.
Disclaimer
All information, articles, and product details provided on this website are for general informational and educational purposes only. We do not claim any ownership over, nor do we intend to infringe upon, any trademarks, copyrights, logos, brand names, or other intellectual property mentioned or depicted on this site. Such intellectual property remains the property of its respective owners, and any references here are made solely for identification or informational purposes, without implying any affiliation, endorsement, or partnership.
We make no representations or warranties, express or implied, regarding the accuracy, completeness, or suitability of any content or products presented. Nothing on this website should be construed as legal, tax, investment, financial, medical, or other professional advice. In addition, no part of this site—including articles or product references—constitutes a solicitation, recommendation, endorsement, advertisement, or offer to buy or sell any securities, franchises, or other financial instruments, particularly in jurisdictions where such activity would be unlawful.
All content is of a general nature and may not address the specific circumstances of any individual or entity. It is not a substitute for professional advice or services. Any actions you take based on the information provided here are strictly at your own risk. You accept full responsibility for any decisions or outcomes arising from your use of this website and agree to release us from any liability in connection with your use of, or reliance upon, the content or products found herein.