
|
SCISPARC LTD. (SPRC) Évaluation DCF |
Entièrement Modifiable: Adapté À Vos Besoins Dans Excel Ou Sheets
Conception Professionnelle: Modèles Fiables Et Conformes Aux Normes Du Secteur
Pré-Construits Pour Une Utilisation Rapide Et Efficace
Compatible MAC/PC, entièrement débloqué
Aucune Expertise N'Est Requise; Facile À Suivre
SciSparc Ltd. (SPRC) Bundle
Vous cherchez à déterminer la valeur intrinsèque de SCISPARC Ltd.? Notre calculatrice SPRC DCF intègre des données réelles avec des fonctionnalités de personnalisation approfondies, vous permettant d'affiner vos prévisions et d'améliorer vos stratégies d'investissement.
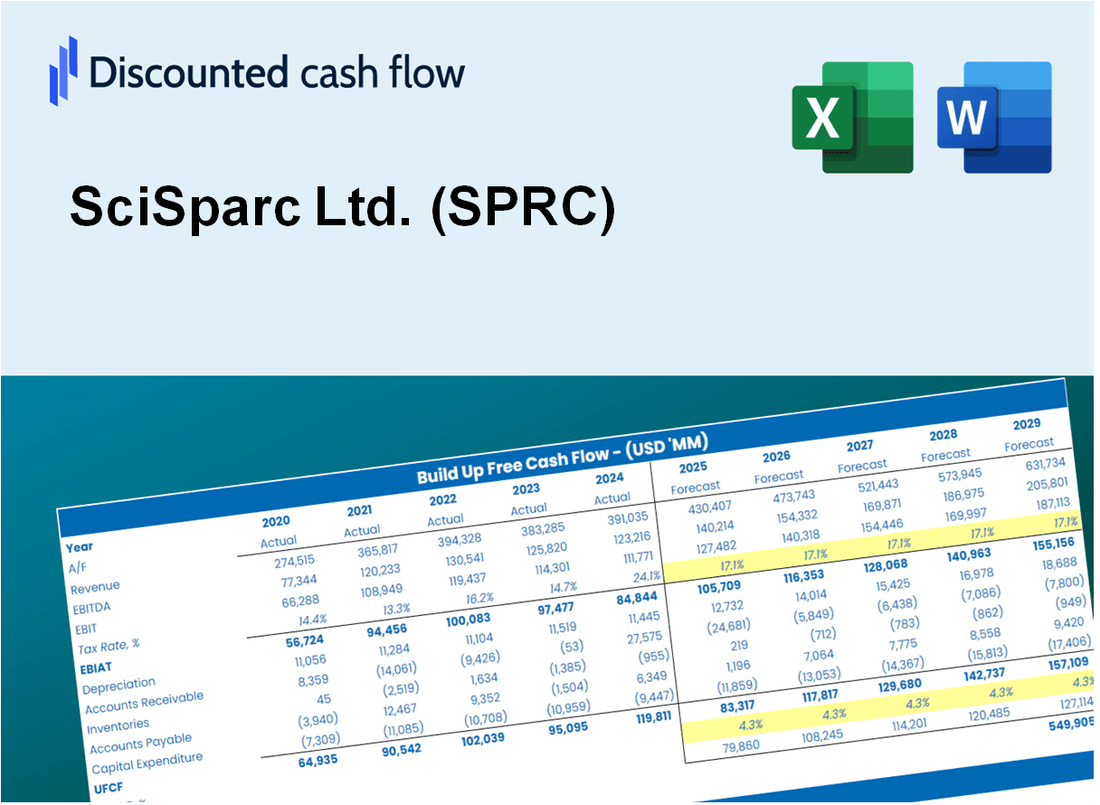
Discounted Cash Flow (DCF) - (USD MM)
| Year | AY1 2020 |
AY2 2021 |
AY3 2022 |
AY4 2023 |
AY5 2024 |
FY1 2025 |
FY2 2026 |
FY3 2027 |
FY4 2028 |
FY5 2029 |
|---|---|---|---|---|---|---|---|---|---|---|
| Revenue | .6 | 1.1 | 1.3 | 2.9 | 1.3 | 1.8 | 2.6 | 3.7 | 5.2 | 7.4 |
| Revenue Growth, % | 0 | 94.36 | 26.01 | 113.73 | -54.64 | 41.43 | 41.43 | 41.43 | 41.43 | 41.43 |
| EBITDA | -2.4 | -5.7 | -2.4 | -5.3 | -7.0 | -1.8 | -2.6 | -3.7 | -5.2 | -7.4 |
| EBITDA, % | -434 | -537.32 | -174.83 | -184.58 | -534 | -100 | -100 | -100 | -100 | -100 |
| Depreciation | .2 | .0 | .2 | .5 | .5 | .4 | .5 | .8 | 1.1 | 1.5 |
| Depreciation, % | 29.82 | 3.09 | 13.88 | 18.69 | 36.91 | 20.48 | 20.48 | 20.48 | 20.48 | 20.48 |
| EBIT | -2.6 | -5.8 | -2.5 | -5.9 | -7.5 | -1.8 | -2.6 | -3.7 | -5.2 | -7.4 |
| EBIT, % | -463.82 | -540.41 | -188.72 | -203.27 | -570.9 | -100 | -100 | -100 | -100 | -100 |
| Total Cash | 1.9 | 6.9 | 3.6 | 5.1 | 2.1 | 1.8 | 2.6 | 3.7 | 5.2 | 7.4 |
| Total Cash, percent | .0 | .0 | .0 | .0 | .0 | .0 | .0 | .0 | .0 | .0 |
| Account Receivables | .3 | 2.6 | .2 | .3 | 5.0 | 1.0 | 1.4 | 2.0 | 2.9 | 4.1 |
| Account Receivables, % | 52 | 239.1 | 12.47 | 9.97 | 380.02 | 54.89 | 54.89 | 54.89 | 54.89 | 54.89 |
| Inventories | .0 | .0 | .7 | .7 | .1 | .3 | .5 | .7 | .9 | 1.3 |
| Inventories, % | 1.82 | 4.21 | 49.59 | 25.77 | 8.65 | 18.01 | 18.01 | 18.01 | 18.01 | 18.01 |
| Accounts Payable | .3 | .4 | .3 | .3 | .8 | .7 | 1.0 | 1.4 | 1.9 | 2.7 |
| Accounts Payable, % | 50.36 | 41.25 | 22.12 | 9.17 | 62.48 | 37.08 | 37.08 | 37.08 | 37.08 | 37.08 |
| Capital Expenditure | .0 | .0 | -4.9 | .0 | .0 | -.4 | -.5 | -.8 | -1.1 | -1.5 |
| Capital Expenditure, % | 0 | -3.27 | -361.47 | 0 | 0 | -20.65 | -20.65 | -20.65 | -20.65 | -20.65 |
| Tax Rate, % | 16.06 | 16.06 | 16.06 | 16.06 | 16.06 | 16.06 | 16.06 | 16.06 | 16.06 | 16.06 |
| EBITAT | -2.5 | -5.8 | -2.6 | -5.1 | -6.3 | -1.7 | -2.5 | -3.5 | -4.9 | -7.0 |
| Depreciation | ||||||||||
| Changes in Account Receivables | ||||||||||
| Changes in Inventories | ||||||||||
| Changes in Accounts Payable | ||||||||||
| Capital Expenditure | ||||||||||
| UFCF | -2.4 | -7.9 | -5.6 | -4.8 | -9.3 | 1.9 | -2.7 | -3.9 | -5.5 | -7.7 |
| WACC, % | 9.68 | 9.69 | 9.69 | 9.66 | 9.65 | 9.67 | 9.67 | 9.67 | 9.67 | 9.67 |
| PV UFCF | ||||||||||
| SUM PV UFCF | -12.2 | |||||||||
| Long Term Growth Rate, % | 2.00 | |||||||||
| Free cash flow (T + 1) | -8 | |||||||||
| Terminal Value | -103 | |||||||||
| Present Terminal Value | -65 | |||||||||
| Enterprise Value | -77 | |||||||||
| Net Debt | -1 | |||||||||
| Equity Value | -76 | |||||||||
| Diluted Shares Outstanding, MM | 6 | |||||||||
| Equity Value Per Share | -12.97 |
What You Will Get
- Real SPRC Financial Data: Pre-filled with SciSparc Ltd.’s historical and projected data for precise analysis.
- Fully Editable Template: Modify key inputs like revenue growth, WACC, and EBITDA % with ease.
- Automatic Calculations: See SciSparc Ltd.’s intrinsic value update instantly based on your changes.
- Professional Valuation Tool: Designed for investors, analysts, and consultants seeking accurate DCF results.
- User-Friendly Design: Simple structure and clear instructions for all experience levels.
Key Features
- Comprehensive SPRC Data: Pre-loaded with SciSparc Ltd.'s historical performance metrics and future growth estimates.
- Highly Customizable Variables: Modify parameters such as revenue growth, profit margins, discount rates, tax considerations, and capital investments.
- Interactive Valuation Framework: Automatic recalculations of Net Present Value (NPV) and intrinsic worth based on your adjustments.
- Multiple Scenario Analysis: Develop various forecasting scenarios to evaluate different valuation results.
- Intuitive User Interface: Clean, organized, and suitable for both seasoned professionals and newcomers.
How It Works
- Download: Obtain the pre-formatted Excel file containing SciSparc Ltd.'s (SPRC) financial data.
- Customize: Tailor forecasts such as revenue growth, EBITDA %, and WACC to your preferences.
- Update Automatically: Enjoy real-time updates for intrinsic value and NPV calculations.
- Test Scenarios: Develop various projections and instantly compare the results.
- Make Decisions: Leverage the valuation outcomes to inform your investment approach.
Why Choose SciSparc Ltd. (SPRC) Calculator?
- All-in-One Solution: Combines DCF, WACC, and financial ratio assessments for comprehensive analysis.
- Flexible Parameters: Modify highlighted cells to explore different financial scenarios.
- In-Depth Analysis: Automatically computes SciSparc’s intrinsic value and Net Present Value.
- Integrated Data: Features historical and projected data for reliable analysis.
- Expert-Level Tool: Perfect for financial analysts, investors, and business advisors.
Who Should Use SciSparc Ltd. (SPRC)?
- Investors: Gain insights into innovative biotech solutions and make informed investment choices.
- Financial Analysts: Utilize comprehensive data to streamline analysis of the biotech sector.
- Consultants: Easily customize reports and presentations for clients interested in biotech opportunities.
- Biotech Enthusiasts: Enhance your knowledge of cutting-edge treatments and technologies through real-world applications.
- Educators and Students: Leverage it as a valuable resource for understanding the biotech industry's dynamics.
What the Template Contains
- Pre-Filled Data: Includes SciSparc Ltd.'s historical financials and forecasts.
- Discounted Cash Flow Model: Editable DCF valuation model with automatic calculations.
- Weighted Average Cost of Capital (WACC): A dedicated sheet for calculating WACC based on custom inputs.
- Key Financial Ratios: Analyze SciSparc Ltd.'s profitability, efficiency, and leverage.
- Customizable Inputs: Edit revenue growth, margins, and tax rates with ease.
- Clear Dashboard: Charts and tables summarizing key valuation results.
Disclaimer
All information, articles, and product details provided on this website are for general informational and educational purposes only. We do not claim any ownership over, nor do we intend to infringe upon, any trademarks, copyrights, logos, brand names, or other intellectual property mentioned or depicted on this site. Such intellectual property remains the property of its respective owners, and any references here are made solely for identification or informational purposes, without implying any affiliation, endorsement, or partnership.
We make no representations or warranties, express or implied, regarding the accuracy, completeness, or suitability of any content or products presented. Nothing on this website should be construed as legal, tax, investment, financial, medical, or other professional advice. In addition, no part of this site—including articles or product references—constitutes a solicitation, recommendation, endorsement, advertisement, or offer to buy or sell any securities, franchises, or other financial instruments, particularly in jurisdictions where such activity would be unlawful.
All content is of a general nature and may not address the specific circumstances of any individual or entity. It is not a substitute for professional advice or services. Any actions you take based on the information provided here are strictly at your own risk. You accept full responsibility for any decisions or outcomes arising from your use of this website and agree to release us from any liability in connection with your use of, or reliance upon, the content or products found herein.