
|
Simpson Manufacturing Co., Inc. (SSD) Évaluation DCF |
Entièrement Modifiable: Adapté À Vos Besoins Dans Excel Ou Sheets
Conception Professionnelle: Modèles Fiables Et Conformes Aux Normes Du Secteur
Pré-Construits Pour Une Utilisation Rapide Et Efficace
Compatible MAC/PC, entièrement débloqué
Aucune Expertise N'Est Requise; Facile À Suivre
Simpson Manufacturing Co., Inc. (SSD) Bundle
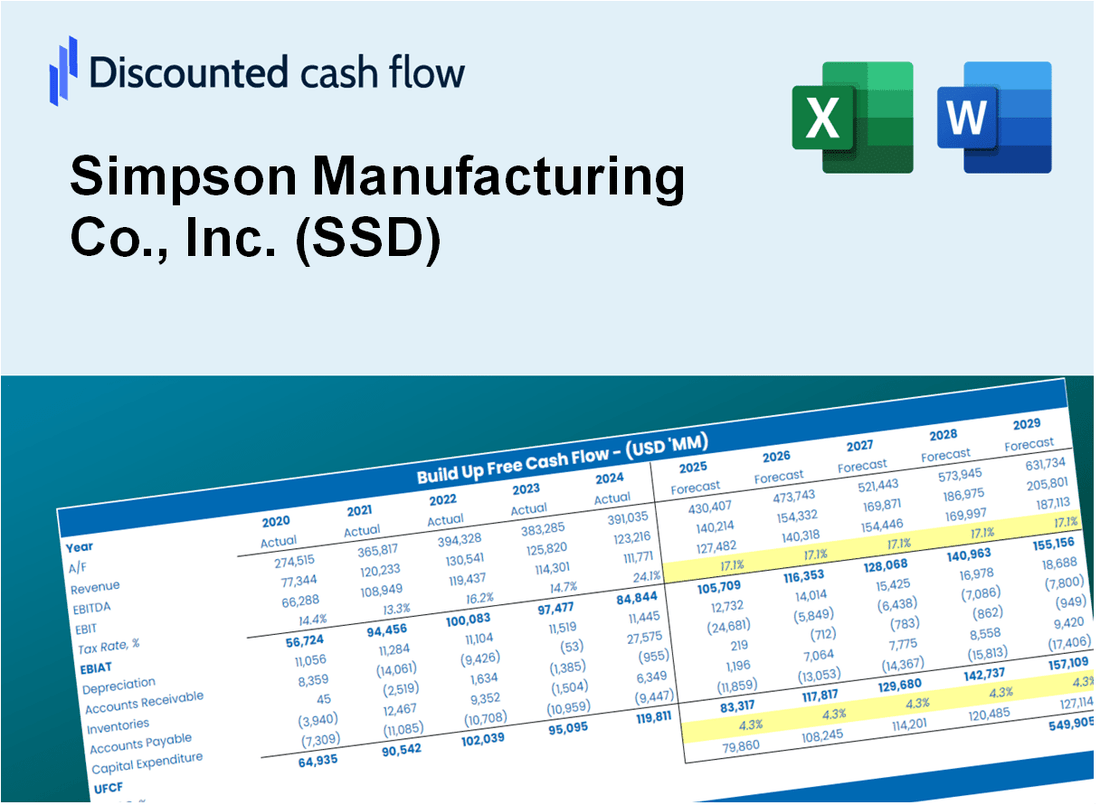
Prenez en charge votre analyse d'évaluation de Simpson Manufacturing Co., Inc. (SSD) avec notre calculatrice DCF de pointe! Préchargé avec des données réelles (SSD), ce modèle Excel vous permet d'ajuster les prévisions et les hypothèses pour déterminer avec précision la valeur intrinsèque de Simpson Manufacturing Co., Inc.
Discounted Cash Flow (DCF) - (USD MM)
| Year | AY1 2020 |
AY2 2021 |
AY3 2022 |
AY4 2023 |
AY5 2024 |
FY1 2025 |
FY2 2026 |
FY3 2027 |
FY4 2028 |
FY5 2029 |
|---|---|---|---|---|---|---|---|---|---|---|
| Revenue | 1,267.9 | 1,573.2 | 2,116.1 | 2,213.8 | 2,232.1 | 2,589.4 | 3,003.9 | 3,484.8 | 4,042.6 | 4,689.7 |
| Revenue Growth, % | 0 | 24.08 | 34.51 | 4.62 | 0.82826 | 16.01 | 16.01 | 16.01 | 16.01 | 16.01 |
| EBITDA | 297.6 | 411.4 | 532.9 | 558.7 | 520.7 | 638.9 | 741.2 | 859.9 | 997.5 | 1,157.2 |
| EBITDA, % | 23.47 | 26.15 | 25.19 | 25.24 | 23.33 | 24.67 | 24.67 | 24.67 | 24.67 | 24.67 |
| Depreciation | 45.8 | 52.0 | 72.2 | 74.7 | 85.4 | 90.8 | 105.3 | 122.2 | 141.7 | 164.4 |
| Depreciation, % | 3.61 | 3.31 | 3.41 | 3.37 | 3.83 | 3.51 | 3.51 | 3.51 | 3.51 | 3.51 |
| EBIT | 251.8 | 359.4 | 460.7 | 484.0 | 435.3 | 548.2 | 635.9 | 737.7 | 855.8 | 992.8 |
| EBIT, % | 19.86 | 22.84 | 21.77 | 21.86 | 19.5 | 21.17 | 21.17 | 21.17 | 21.17 | 21.17 |
| Total Cash | 274.6 | 301.2 | 300.7 | 429.8 | 239.4 | 441.0 | 511.6 | 593.5 | 688.5 | 798.7 |
| Total Cash, percent | .0 | .0 | .0 | .0 | .0 | .0 | .0 | .0 | .0 | .0 |
| Account Receivables | 165.1 | 231.0 | 269.1 | 284.0 | 284.4 | 341.8 | 396.5 | 460.0 | 533.6 | 619.0 |
| Account Receivables, % | 13.02 | 14.68 | 12.72 | 12.83 | 12.74 | 13.2 | 13.2 | 13.2 | 13.2 | 13.2 |
| Inventories | 283.7 | 443.8 | 556.8 | 551.6 | 593.2 | 664.9 | 771.3 | 894.8 | 1,038.0 | 1,204.2 |
| Inventories, % | 22.38 | 28.21 | 26.31 | 24.92 | 26.57 | 25.68 | 25.68 | 25.68 | 25.68 | 25.68 |
| Accounts Payable | 48.3 | 57.2 | 97.8 | 107.5 | 101.0 | 111.1 | 128.9 | 149.5 | 173.4 | 201.2 |
| Accounts Payable, % | 3.81 | 3.64 | 4.62 | 4.86 | 4.52 | 4.29 | 4.29 | 4.29 | 4.29 | 4.29 |
| Capital Expenditure | -37.9 | -49.6 | -62.4 | -88.8 | -180.4 | -109.7 | -127.3 | -147.6 | -171.3 | -198.7 |
| Capital Expenditure, % | -2.99 | -3.15 | -2.95 | -4.01 | -8.08 | -4.24 | -4.24 | -4.24 | -4.24 | -4.24 |
| Tax Rate, % | 25.76 | 25.76 | 25.76 | 25.76 | 25.76 | 25.76 | 25.76 | 25.76 | 25.76 | 25.76 |
| EBITAT | 188.7 | 267.1 | 343.4 | 359.5 | 323.2 | 408.2 | 473.5 | 549.3 | 637.2 | 739.2 |
| Depreciation | ||||||||||
| Changes in Account Receivables | ||||||||||
| Changes in Inventories | ||||||||||
| Changes in Accounts Payable | ||||||||||
| Capital Expenditure | ||||||||||
| UFCF | -204.0 | 52.6 | 242.8 | 345.4 | 179.7 | 270.2 | 308.2 | 357.5 | 414.8 | 481.2 |
| WACC, % | 9.96 | 9.96 | 9.96 | 9.96 | 9.96 | 9.96 | 9.96 | 9.96 | 9.96 | 9.96 |
| PV UFCF | ||||||||||
| SUM PV UFCF | 1,352.7 | |||||||||
| Long Term Growth Rate, % | 4.00 | |||||||||
| Free cash flow (T + 1) | 500 | |||||||||
| Terminal Value | 8,400 | |||||||||
| Present Terminal Value | 5,226 | |||||||||
| Enterprise Value | 6,578 | |||||||||
| Net Debt | 241 | |||||||||
| Equity Value | 6,337 | |||||||||
| Diluted Shares Outstanding, MM | 42 | |||||||||
| Equity Value Per Share | 149.52 |
What You Will Get
- Real SSD Financials: Access to historical and projected data for precise valuation.
- Adjustable Inputs: Customize WACC, tax rates, revenue growth, and capital expenditures.
- Automatic Calculations: Intrinsic value and NPV are computed in real-time.
- Scenario Analysis: Explore various scenarios to assess Simpson Manufacturing's future performance.
- Clear and Intuitive Design: Designed for industry professionals while remaining user-friendly for newcomers.
Key Features
- 🔍 Real-Life SSD Financials: Pre-filled historical and projected data for Simpson Manufacturing Co., Inc. (SSD).
- ✏️ Fully Customizable Inputs: Adjust all critical parameters (yellow cells) like WACC, growth %, and tax rates.
- 📊 Professional DCF Valuation: Built-in formulas calculate Simpson’s intrinsic value using the Discounted Cash Flow method.
- ⚡ Instant Results: Visualize Simpson’s valuation instantly after making changes.
- Scenario Analysis: Test and compare outcomes for various financial assumptions side-by-side.
How It Works
- Step 1: Download the Excel file.
- Step 2: Review pre-entered Simpson Manufacturing Co., Inc. (SSD) data (historical and projected).
- Step 3: Adjust key assumptions (yellow cells) based on your analysis.
- Step 4: View automatic recalculations for Simpson Manufacturing Co., Inc. (SSD)’s intrinsic value.
- Step 5: Use the outputs for investment decisions or reporting.
Why Choose This Calculator for Simpson Manufacturing Co., Inc. (SSD)?
- Designed for Experts: A sophisticated tool utilized by industry analysts, CFOs, and financial consultants.
- Accurate Data: Historical and projected financials for Simpson Manufacturing preloaded for precision.
- Scenario Analysis: Effortlessly simulate various forecasts and assumptions.
- Comprehensive Outputs: Automatically computes intrinsic value, NPV, and essential financial metrics.
- User-Friendly: Step-by-step guidance makes the process straightforward.
Who Should Use This Product?
- Professional Investors: Develop comprehensive and accurate valuation models for portfolio assessment of Simpson Manufacturing Co., Inc. (SSD).
- Corporate Finance Teams: Evaluate valuation scenarios to inform strategic decisions within the organization.
- Consultants and Advisors: Deliver precise valuation insights to clients considering investments in Simpson Manufacturing Co., Inc. (SSD).
- Students and Educators: Utilize real-world data to enhance learning and practice in financial modeling.
- Construction Industry Professionals: Gain insight into the valuation metrics that impact companies like Simpson Manufacturing Co., Inc. (SSD).
What the Template Contains
- Operating and Balance Sheet Data: Pre-filled Simpson Manufacturing Co., Inc. (SSD) historical data and forecasts, including revenue, EBITDA, EBIT, and capital expenditures.
- WACC Calculation: A dedicated sheet for Weighted Average Cost of Capital (WACC), featuring parameters like Beta, risk-free rate, and share price.
- DCF Valuation (Unlevered and Levered): Editable Discounted Cash Flow models illustrating intrinsic value with detailed calculations.
- Financial Statements: Pre-loaded financial statements (annual and quarterly) to support analysis.
- Key Ratios: Includes profitability, leverage, and efficiency ratios for Simpson Manufacturing Co., Inc. (SSD).
- Dashboard and Charts: Visual summary of valuation outputs and assumptions to facilitate easy analysis of results.
Disclaimer
All information, articles, and product details provided on this website are for general informational and educational purposes only. We do not claim any ownership over, nor do we intend to infringe upon, any trademarks, copyrights, logos, brand names, or other intellectual property mentioned or depicted on this site. Such intellectual property remains the property of its respective owners, and any references here are made solely for identification or informational purposes, without implying any affiliation, endorsement, or partnership.
We make no representations or warranties, express or implied, regarding the accuracy, completeness, or suitability of any content or products presented. Nothing on this website should be construed as legal, tax, investment, financial, medical, or other professional advice. In addition, no part of this site—including articles or product references—constitutes a solicitation, recommendation, endorsement, advertisement, or offer to buy or sell any securities, franchises, or other financial instruments, particularly in jurisdictions where such activity would be unlawful.
All content is of a general nature and may not address the specific circumstances of any individual or entity. It is not a substitute for professional advice or services. Any actions you take based on the information provided here are strictly at your own risk. You accept full responsibility for any decisions or outcomes arising from your use of this website and agree to release us from any liability in connection with your use of, or reliance upon, the content or products found herein.