
|
SS&C Technologies Holdings, Inc. (SSNC) Évaluation DCF |
Entièrement Modifiable: Adapté À Vos Besoins Dans Excel Ou Sheets
Conception Professionnelle: Modèles Fiables Et Conformes Aux Normes Du Secteur
Pré-Construits Pour Une Utilisation Rapide Et Efficace
Compatible MAC/PC, entièrement débloqué
Aucune Expertise N'Est Requise; Facile À Suivre
SS&C Technologies Holdings, Inc. (SSNC) Bundle
Conçu pour la précision, notre calculatrice DCF SS&C Technologies Holdings, Inc. (SSNC) vous permet d'évaluer l'évaluation de l'entreprise à l'aide de données financières réelles, offrant une flexibilité complète pour modifier tous les paramètres essentiels pour des projections améliorées.
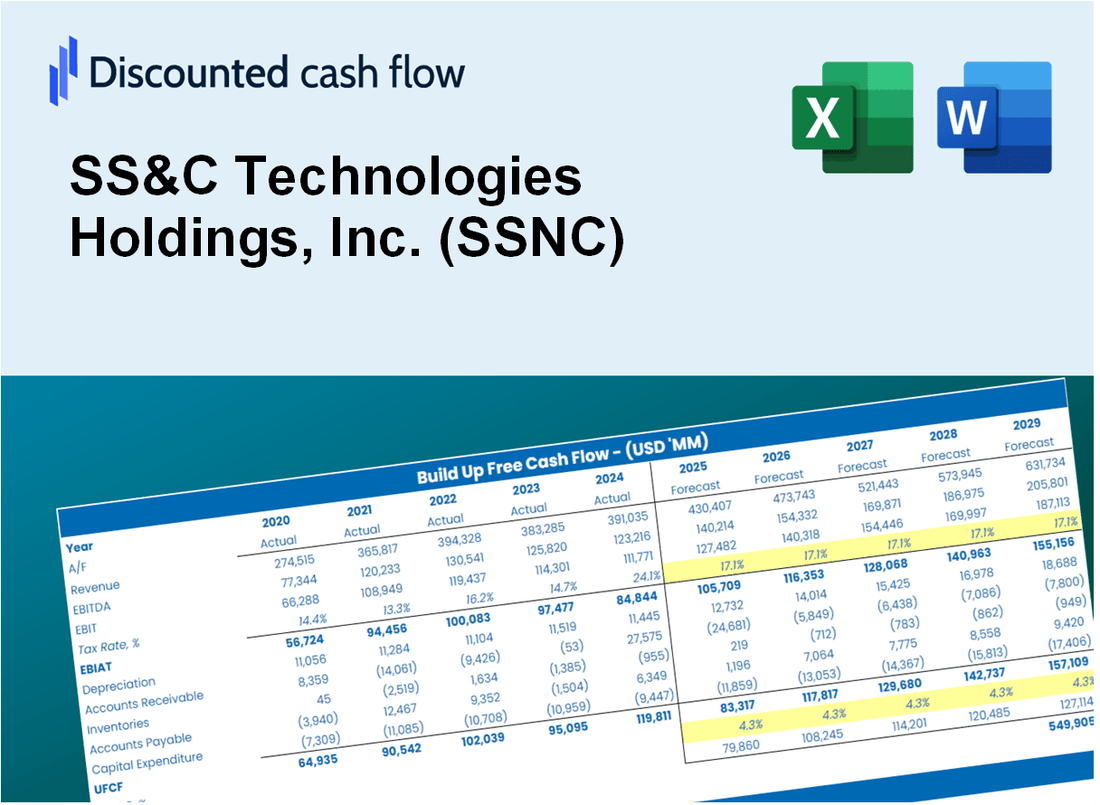
Discounted Cash Flow (DCF) - (USD MM)
| Year | AY1 2020 |
AY2 2021 |
AY3 2022 |
AY4 2023 |
AY5 2024 |
FY1 2025 |
FY2 2026 |
FY3 2027 |
FY4 2028 |
FY5 2029 |
|---|---|---|---|---|---|---|---|---|---|---|
| Revenue | 4,667.9 | 5,051.0 | 5,283.0 | 5,502.8 | 5,882.0 | 6,232.7 | 6,604.4 | 6,998.2 | 7,415.5 | 7,857.7 |
| Revenue Growth, % | 0 | 8.21 | 4.59 | 4.16 | 6.89 | 5.96 | 5.96 | 5.96 | 5.96 | 5.96 |
| EBITDA | 1,751.0 | 1,910.1 | 1,859.9 | 2,004.4 | 2,036.8 | 2,263.6 | 2,398.5 | 2,541.6 | 2,693.1 | 2,853.7 |
| EBITDA, % | 37.51 | 37.82 | 35.21 | 36.43 | 34.63 | 36.32 | 36.32 | 36.32 | 36.32 | 36.32 |
| Depreciation | 725.3 | 667.4 | 671.5 | 670.4 | 680.1 | 812.8 | 861.3 | 912.7 | 967.1 | 1,024.8 |
| Depreciation, % | 15.54 | 13.21 | 12.71 | 12.18 | 11.56 | 13.04 | 13.04 | 13.04 | 13.04 | 13.04 |
| EBIT | 1,025.7 | 1,242.7 | 1,188.4 | 1,334.0 | 1,356.7 | 1,450.7 | 1,537.2 | 1,628.9 | 1,726.0 | 1,828.9 |
| EBIT, % | 21.97 | 24.6 | 22.49 | 24.24 | 23.07 | 23.28 | 23.28 | 23.28 | 23.28 | 23.28 |
| Total Cash | 215.2 | 3,171.4 | 1,337.6 | 2,998.6 | 3,370.5 | 2,549.3 | 2,701.3 | 2,862.4 | 3,033.1 | 3,214.0 |
| Total Cash, percent | .0 | .0 | .0 | .0 | .0 | .0 | .0 | .0 | .0 | .0 |
| Account Receivables | 1,895.8 | 893.3 | 893.0 | 887.1 | 1,312.1 | 1,416.5 | 1,500.9 | 1,590.4 | 1,685.3 | 1,785.7 |
| Account Receivables, % | 40.61 | 17.69 | 16.9 | 16.12 | 22.31 | 22.73 | 22.73 | 22.73 | 22.73 | 22.73 |
| Inventories | .0 | .0 | .0 | .0 | .0 | .0 | .0 | .0 | .0 | .0 |
| Inventories, % | 0 | 0 | 0 | 0 | 0 | 0 | 0 | 0 | 0 | 0 |
| Accounts Payable | 28.1 | 28.7 | 49.5 | 80.3 | 70.2 | 59.3 | 62.9 | 66.6 | 70.6 | 74.8 |
| Accounts Payable, % | 0.60198 | 0.5682 | 0.93697 | 1.46 | 1.19 | 0.95198 | 0.95198 | 0.95198 | 0.95198 | 0.95198 |
| Capital Expenditure | -106.4 | -136.6 | -208.3 | -251.5 | -61.4 | -181.3 | -192.1 | -203.5 | -215.7 | -228.5 |
| Capital Expenditure, % | -2.28 | -2.7 | -3.94 | -4.57 | -1.04 | -2.91 | -2.91 | -2.91 | -2.91 | -2.91 |
| Tax Rate, % | 14.9 | 14.9 | 14.9 | 14.9 | 14.9 | 14.9 | 14.9 | 14.9 | 14.9 | 14.9 |
| EBITAT | 826.6 | 958.7 | 882.0 | 944.2 | 1,154.5 | 1,125.3 | 1,192.4 | 1,263.5 | 1,338.8 | 1,418.6 |
| Depreciation | ||||||||||
| Changes in Account Receivables | ||||||||||
| Changes in Inventories | ||||||||||
| Changes in Accounts Payable | ||||||||||
| Capital Expenditure | ||||||||||
| UFCF | -422.2 | 2,492.6 | 1,366.3 | 1,399.8 | 1,338.1 | 1,641.6 | 1,780.7 | 1,886.8 | 1,999.4 | 2,118.6 |
| WACC, % | 8.35 | 8.29 | 8.24 | 8.19 | 8.42 | 8.3 | 8.3 | 8.3 | 8.3 | 8.3 |
| PV UFCF | ||||||||||
| SUM PV UFCF | 7,395.0 | |||||||||
| Long Term Growth Rate, % | 2.00 | |||||||||
| Free cash flow (T + 1) | 2,161 | |||||||||
| Terminal Value | 34,306 | |||||||||
| Present Terminal Value | 23,027 | |||||||||
| Enterprise Value | 30,422 | |||||||||
| Net Debt | 3,814 | |||||||||
| Equity Value | 26,608 | |||||||||
| Diluted Shares Outstanding, MM | 254 | |||||||||
| Equity Value Per Share | 104.84 |
What You Will Get
- Real SS&C Data: Preloaded financials – from revenue to EBIT – based on actual and projected figures for SS&C Technologies Holdings, Inc. (SSNC).
- Full Customization: Adjust all critical parameters (yellow cells) such as WACC, growth %, and tax rates specific to SS&C.
- Instant Valuation Updates: Automatic recalculations to analyze the impact of changes on SS&C’s fair value.
- Versatile Excel Template: Designed for quick edits, scenario testing, and detailed projections tailored for SS&C.
- Time-Saving and Accurate: Avoid building models from scratch while ensuring precision and flexibility for SS&C Technologies Holdings, Inc. (SSNC).
Key Features
- Accurate SS&C Financial Data: Gain access to reliable pre-loaded historical information and future estimates.
- Adjustable Forecast Parameters: Modify highlighted cells for metrics such as WACC, growth rates, and profit margins.
- Real-Time Calculations: Instant updates for DCF, Net Present Value (NPV), and cash flow assessments.
- Interactive Dashboard: User-friendly charts and summaries to effectively present your valuation findings.
- Designed for All Users: An intuitive layout tailored for investors, CFOs, and consultants alike.
How It Works
- Download: Obtain the pre-configured Excel file featuring SS&C Technologies Holdings, Inc.'s (SSNC) financial data.
- Customize: Modify projections, including revenue growth, EBITDA %, and WACC.
- Update Automatically: The intrinsic value and NPV calculations refresh in real-time.
- Test Scenarios: Develop various forecasts and evaluate results instantly.
- Make Decisions: Leverage the valuation findings to inform your investment strategy.
Why Choose SS&C Technologies Holdings, Inc. (SSNC) Calculator?
- Precision: Utilizes accurate SS&C financial data for reliable results.
- Versatility: Tailored for users to easily adjust and experiment with inputs.
- Efficiency: Avoid the complexity of creating a financial model from the ground up.
- Expert-Level: Crafted with the expertise and usability expected by finance professionals.
- Intuitive: Simple to navigate, making it accessible for users without extensive financial modeling skills.
Who Should Use SS&C Technologies Holdings, Inc. (SSNC)?
- Investors: Gain insights and make informed decisions with advanced analytics tools.
- Financial Analysts: Enhance efficiency with customizable financial modeling solutions.
- Consultants: Tailor the platform for impactful client presentations and strategic reports.
- Finance Enthusiasts: Explore comprehensive resources to expand your knowledge of financial technologies.
- Educators and Students: Utilize the platform as a hands-on resource in finance and technology courses.
What the Template Contains
- Pre-Filled DCF Model: SS&C Technologies' financial data preloaded for immediate use.
- WACC Calculator: Detailed calculations for Weighted Average Cost of Capital.
- Financial Ratios: Evaluate SS&C Technologies' profitability, leverage, and efficiency.
- Editable Inputs: Change assumptions such as growth, margins, and CAPEX to fit your scenarios.
- Financial Statements: Annual and quarterly reports to support detailed analysis.
- Interactive Dashboard: Easily visualize key valuation metrics and results.
Disclaimer
All information, articles, and product details provided on this website are for general informational and educational purposes only. We do not claim any ownership over, nor do we intend to infringe upon, any trademarks, copyrights, logos, brand names, or other intellectual property mentioned or depicted on this site. Such intellectual property remains the property of its respective owners, and any references here are made solely for identification or informational purposes, without implying any affiliation, endorsement, or partnership.
We make no representations or warranties, express or implied, regarding the accuracy, completeness, or suitability of any content or products presented. Nothing on this website should be construed as legal, tax, investment, financial, medical, or other professional advice. In addition, no part of this site—including articles or product references—constitutes a solicitation, recommendation, endorsement, advertisement, or offer to buy or sell any securities, franchises, or other financial instruments, particularly in jurisdictions where such activity would be unlawful.
All content is of a general nature and may not address the specific circumstances of any individual or entity. It is not a substitute for professional advice or services. Any actions you take based on the information provided here are strictly at your own risk. You accept full responsibility for any decisions or outcomes arising from your use of this website and agree to release us from any liability in connection with your use of, or reliance upon, the content or products found herein.