
|
The One Group Hospitality, Inc. (STKS) DCF Valation |
Entièrement Modifiable: Adapté À Vos Besoins Dans Excel Ou Sheets
Conception Professionnelle: Modèles Fiables Et Conformes Aux Normes Du Secteur
Pré-Construits Pour Une Utilisation Rapide Et Efficace
Compatible MAC/PC, entièrement débloqué
Aucune Expertise N'Est Requise; Facile À Suivre
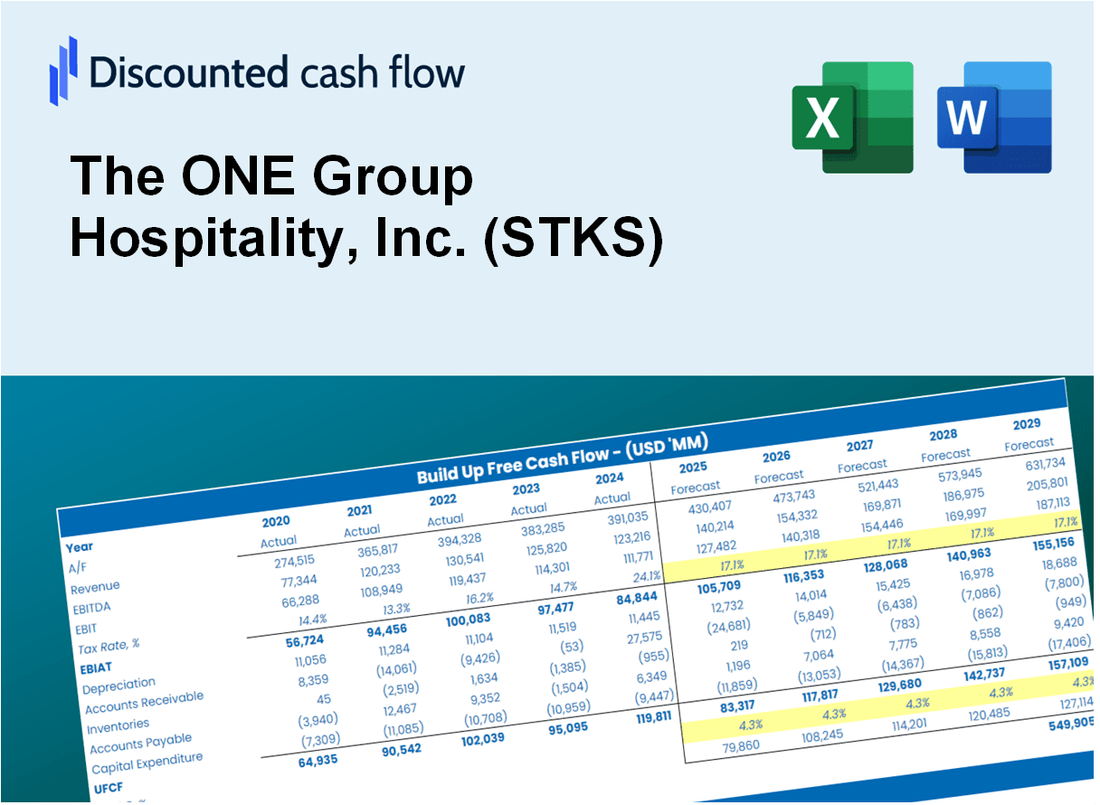
The ONE Group Hospitality, Inc. (STKS) Bundle
Vous cherchez à déterminer la valeur intrinsèque de One Group Hospitality, Inc.? Notre calculatrice (STKS) DCF intègre des données réelles avec des fonctionnalités de personnalisation complètes, vous permettant d'affiner vos prévisions et d'améliorer vos stratégies d'investissement.
Discounted Cash Flow (DCF) - (USD MM)
| Year | AY1 2020 |
AY2 2021 |
AY3 2022 |
AY4 2023 |
AY5 2024 |
FY1 2025 |
FY2 2026 |
FY3 2027 |
FY4 2028 |
FY5 2029 |
|---|---|---|---|---|---|---|---|---|---|---|
| Revenue | 141.9 | 277.2 | 316.6 | 332.8 | 673.3 | 1,034.6 | 1,589.7 | 2,442.6 | 3,753.0 | 5,766.6 |
| Revenue Growth, % | 0 | 95.27 | 14.24 | 5.09 | 102.35 | 53.65 | 53.65 | 53.65 | 53.65 | 53.65 |
| EBITDA | -3.6 | 38.6 | 28.4 | 34.0 | 40.7 | 75.8 | 116.5 | 179.0 | 275.1 | 422.6 |
| EBITDA, % | -2.52 | 13.92 | 8.98 | 10.22 | 6.05 | 7.33 | 7.33 | 7.33 | 7.33 | 7.33 |
| Depreciation | 10.1 | 10.8 | 12.1 | 15.7 | 34.1 | 50.9 | 78.3 | 120.3 | 184.8 | 284.0 |
| Depreciation, % | 7.13 | 3.89 | 3.83 | 4.71 | 5.06 | 4.92 | 4.92 | 4.92 | 4.92 | 4.92 |
| EBIT | -13.7 | 27.8 | 16.3 | 18.4 | 6.6 | 24.9 | 38.2 | 58.7 | 90.3 | 138.7 |
| EBIT, % | -9.65 | 10.02 | 5.15 | 5.52 | 0.98345 | 2.4 | 2.4 | 2.4 | 2.4 | 2.4 |
| Total Cash | 24.4 | 23.6 | 55.1 | 21.0 | 28.1 | 110.9 | 170.4 | 261.8 | 402.3 | 618.2 |
| Total Cash, percent | .0 | .0 | .0 | .0 | .0 | .0 | .0 | .0 | .0 | .0 |
| Account Receivables | 6.2 | 11.7 | 15.6 | 17.6 | 23.1 | 46.0 | 70.7 | 108.6 | 166.9 | 256.4 |
| Account Receivables, % | 4.33 | 4.23 | 4.93 | 5.3 | 3.44 | 4.45 | 4.45 | 4.45 | 4.45 | 4.45 |
| Inventories | 2.5 | 3.9 | 5.7 | 6.2 | 11.3 | 17.6 | 27.1 | 41.6 | 63.9 | 98.2 |
| Inventories, % | 1.75 | 1.41 | 1.81 | 1.86 | 1.68 | 1.7 | 1.7 | 1.7 | 1.7 | 1.7 |
| Accounts Payable | 7.4 | 11.1 | 13.1 | 19.1 | 30.9 | 49.0 | 75.2 | 115.6 | 177.6 | 272.9 |
| Accounts Payable, % | 5.22 | 4 | 4.12 | 5.74 | 4.59 | 4.73 | 4.73 | 4.73 | 4.73 | 4.73 |
| Capital Expenditure | -5.8 | -11.5 | -32.6 | -53.6 | -71.6 | -93.6 | -143.8 | -221.0 | -339.6 | -521.7 |
| Capital Expenditure, % | -4.08 | -4.14 | -10.3 | -16.09 | -10.63 | -9.05 | -9.05 | -9.05 | -9.05 | -9.05 |
| Tax Rate, % | 35.38 | 35.38 | 35.38 | 35.38 | 35.38 | 35.38 | 35.38 | 35.38 | 35.38 | 35.38 |
| EBITAT | -9.2 | 26.0 | 15.5 | 38.2 | 4.3 | 20.9 | 32.2 | 49.4 | 76.0 | 116.7 |
| Depreciation | ||||||||||
| Changes in Account Receivables | ||||||||||
| Changes in Inventories | ||||||||||
| Changes in Accounts Payable | ||||||||||
| Capital Expenditure | ||||||||||
| UFCF | -6.1 | 22.0 | -8.7 | 3.9 | -32.0 | -32.8 | -41.2 | -63.3 | -97.3 | -149.6 |
| WACC, % | 4.38 | 5.51 | 5.59 | 5.79 | 4.26 | 5.11 | 5.11 | 5.11 | 5.11 | 5.11 |
| PV UFCF | ||||||||||
| SUM PV UFCF | -319.4 | |||||||||
| Long Term Growth Rate, % | 3.00 | |||||||||
| Free cash flow (T + 1) | -154 | |||||||||
| Terminal Value | -7,317 | |||||||||
| Present Terminal Value | -5,705 | |||||||||
| Enterprise Value | -6,024 | |||||||||
| Net Debt | 613 | |||||||||
| Equity Value | -6,637 | |||||||||
| Diluted Shares Outstanding, MM | 31 | |||||||||
| Equity Value Per Share | -213.05 |
What You Will Get
- Editable Forecast Inputs: Easily modify assumptions (growth %, margins, WACC) to explore various scenarios.
- Real-World Data: The ONE Group Hospitality, Inc.'s (STKS) financial data pre-filled to kickstart your analysis.
- Automatic DCF Outputs: The template computes Net Present Value (NPV) and intrinsic value automatically.
- Customizable and Professional: A refined Excel model that adjusts to your valuation requirements.
- Built for Analysts and Investors: Perfect for assessing projections, validating strategies, and enhancing efficiency.
Key Features
- Comprehensive Financial Data: The ONE Group Hospitality, Inc.'s historical financial statements and pre-filled projections.
- Customizable Variables: Adjust WACC, tax rates, revenue growth, and EBITDA margins to fit your analysis.
- Real-Time Valuation: Instantly see the intrinsic value of The ONE Group Hospitality, Inc. recalculated.
- Intuitive Visualizations: Dashboard charts showcase valuation results and essential metrics clearly.
- Designed for Precision: A professional-grade tool tailored for analysts, investors, and finance professionals.
How It Works
- Step 1: Download the Excel file for The ONE Group Hospitality, Inc. (STKS).
- Step 2: Review the pre-filled financial data and forecasts for The ONE Group.
- Step 3: Adjust key inputs such as revenue growth, WACC, and tax rates (highlighted cells).
- Step 4: Observe the DCF model update in real-time as you modify your assumptions.
- Step 5: Evaluate the outputs and leverage the results for your investment strategies.
Why Choose The ONE Group Hospitality, Inc. (STKS)?
- Streamlined Experience: Enjoy a hassle-free process with our ready-to-use solutions.
- Enhanced Precision: Dependable data and methodologies minimize valuation discrepancies.
- Completely Adaptable: Modify our offerings to align with your unique business strategies and forecasts.
- User-Friendly Insights: Intuitive visuals and outputs facilitate straightforward analysis of results.
- Endorsed by Industry Leaders: Crafted for professionals who prioritize accuracy and functionality.
Who Should Use This Product?
- Investors: Make informed investment choices with insights from The ONE Group Hospitality, Inc. (STKS).
- Financial Analysts: Streamline your workflow with a customizable financial model tailored for the hospitality sector.
- Consultants: Efficiently modify the template for client presentations or in-depth reports on hospitality trends.
- Finance Enthusiasts: Enhance your knowledge of the hospitality industry through practical examples and case studies.
- Educators and Students: Utilize this resource as a hands-on learning tool in hospitality and finance courses.
What the Template Contains
- Comprehensive DCF Model: Editable template with detailed valuation calculations tailored for The ONE Group Hospitality, Inc. (STKS).
- Real-World Data: The ONE Group's historical and projected financials preloaded for in-depth analysis.
- Customizable Parameters: Modify WACC, growth rates, and tax assumptions to explore various scenarios.
- Financial Statements: Complete annual and quarterly breakdowns for enhanced insights into performance.
- Key Ratios: Integrated analysis for profitability, efficiency, and leverage specific to The ONE Group Hospitality, Inc. (STKS).
- Dashboard with Visual Outputs: Charts and tables providing clear, actionable results for informed decision-making.
Disclaimer
All information, articles, and product details provided on this website are for general informational and educational purposes only. We do not claim any ownership over, nor do we intend to infringe upon, any trademarks, copyrights, logos, brand names, or other intellectual property mentioned or depicted on this site. Such intellectual property remains the property of its respective owners, and any references here are made solely for identification or informational purposes, without implying any affiliation, endorsement, or partnership.
We make no representations or warranties, express or implied, regarding the accuracy, completeness, or suitability of any content or products presented. Nothing on this website should be construed as legal, tax, investment, financial, medical, or other professional advice. In addition, no part of this site—including articles or product references—constitutes a solicitation, recommendation, endorsement, advertisement, or offer to buy or sell any securities, franchises, or other financial instruments, particularly in jurisdictions where such activity would be unlawful.
All content is of a general nature and may not address the specific circumstances of any individual or entity. It is not a substitute for professional advice or services. Any actions you take based on the information provided here are strictly at your own risk. You accept full responsibility for any decisions or outcomes arising from your use of this website and agree to release us from any liability in connection with your use of, or reliance upon, the content or products found herein.