
|
Starwood Property Trust, Inc. (STWD) Évaluation DCF |
Entièrement Modifiable: Adapté À Vos Besoins Dans Excel Ou Sheets
Conception Professionnelle: Modèles Fiables Et Conformes Aux Normes Du Secteur
Pré-Construits Pour Une Utilisation Rapide Et Efficace
Compatible MAC/PC, entièrement débloqué
Aucune Expertise N'Est Requise; Facile À Suivre
Starwood Property Trust, Inc. (STWD) Bundle
Évaluez les perspectives financières de Starwood Property Trust, Inc. (STWD) comme un expert! Cette calculatrice DCF (STWD) vous fournit des données financières pré-remplies et la liberté complète de modifier la croissance des revenus, le WACC, les marges et d'autres hypothèses essentielles pour s'aligner sur vos prévisions.
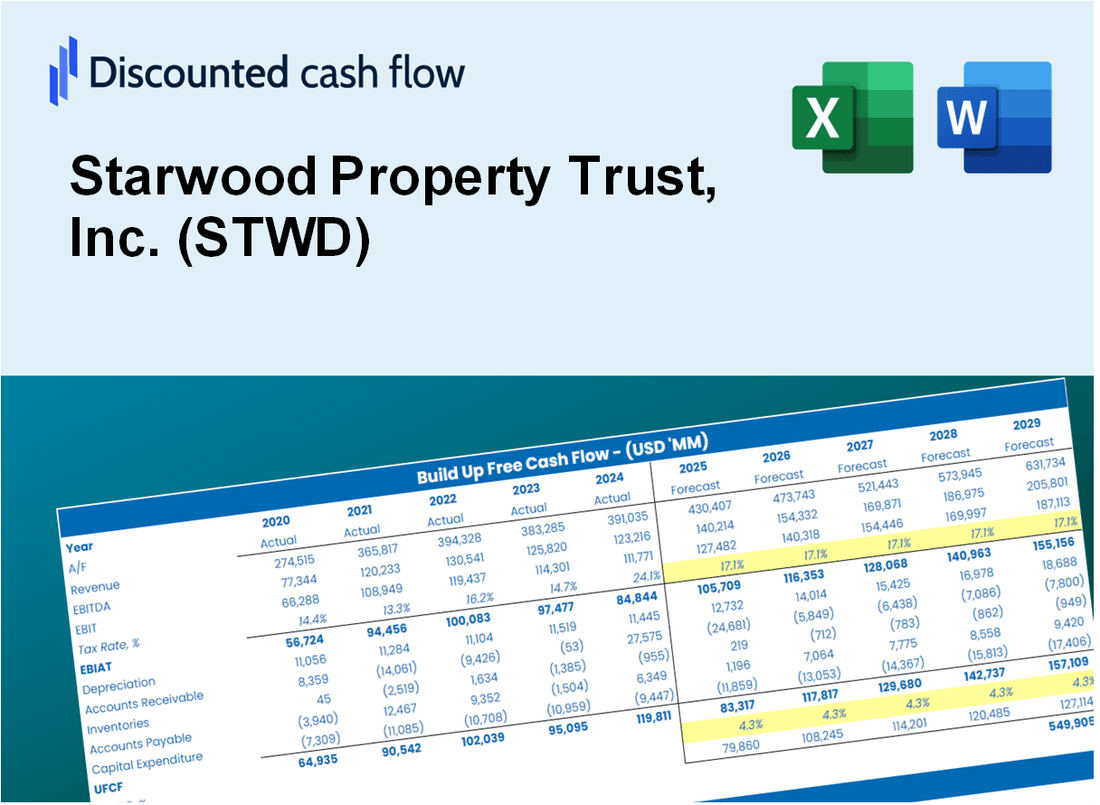
Discounted Cash Flow (DCF) - (USD MM)
| Year | AY1 2020 |
AY2 2021 |
AY3 2022 |
AY4 2023 |
AY5 2024 |
FY1 2025 |
FY2 2026 |
FY3 2027 |
FY4 2028 |
FY5 2029 |
|---|---|---|---|---|---|---|---|---|---|---|
| Revenue | 822.4 | 885.1 | 1,449.6 | 1,016.5 | 1,946.8 | 2,594.4 | 3,457.3 | 4,607.2 | 6,139.6 | 8,181.7 |
| Revenue Growth, % | 0 | 7.62 | 63.77 | -29.88 | 91.53 | 33.26 | 33.26 | 33.26 | 33.26 | 33.26 |
| EBITDA | .0 | .0 | 1,553.1 | 54.2 | 1,801.0 | 1,026.6 | 1,368.0 | 1,823.0 | 2,429.4 | 3,237.4 |
| EBITDA, % | 0 | 0 | 107.14 | 5.34 | 92.51 | 39.57 | 39.57 | 39.57 | 39.57 | 39.57 |
| Depreciation | 493.6 | 390.8 | 490.9 | 49.1 | 46.3 | 753.6 | 1,004.3 | 1,338.3 | 1,783.5 | 2,376.7 |
| Depreciation, % | 60.02 | 44.15 | 33.86 | 4.83 | 2.38 | 29.05 | 29.05 | 29.05 | 29.05 | 29.05 |
| EBIT | -493.6 | -390.8 | 1,062.2 | 5.1 | 1,754.7 | 310.0 | 413.1 | 550.5 | 733.6 | 977.6 |
| EBIT, % | -60.02 | -44.15 | 73.28 | 0.50193 | 90.13 | 11.95 | 11.95 | 11.95 | 11.95 | 11.95 |
| Total Cash | 563.2 | 217.4 | 18,662.5 | 258.1 | 911.1 | 1,376.2 | 1,833.9 | 2,443.9 | 3,256.8 | 4,340.0 |
| Total Cash, percent | .0 | .0 | .0 | .0 | .0 | .0 | .0 | .0 | .0 | .0 |
| Account Receivables | 96.0 | 116.3 | 168.5 | 200.9 | 167.8 | 336.3 | 448.1 | 597.2 | 795.8 | 1,060.5 |
| Account Receivables, % | 11.67 | 13.13 | 11.63 | 19.76 | 8.62 | 12.96 | 12.96 | 12.96 | 12.96 | 12.96 |
| Inventories | .0 | .0 | .0 | .0 | .0 | .0 | .0 | .0 | .0 | .0 |
| Inventories, % | 0 | 0 | 0 | 0 | 0 | 0 | 0 | 0 | 0 | 0 |
| Accounts Payable | 200.8 | 189.7 | 289.1 | 244.9 | .0 | 466.4 | 621.5 | 828.2 | 1,103.6 | 1,470.7 |
| Accounts Payable, % | 24.41 | 21.43 | 19.95 | 24.09 | 0 | 17.98 | 17.98 | 17.98 | 17.98 | 17.98 |
| Capital Expenditure | -25.2 | -26.3 | -25.2 | -25.1 | -27.9 | -60.6 | -80.7 | -107.5 | -143.3 | -191.0 |
| Capital Expenditure, % | -3.06 | -2.97 | -1.74 | -2.47 | -1.44 | -2.33 | -2.33 | -2.33 | -2.33 | -2.33 |
| Tax Rate, % | 11.35 | 11.35 | 11.35 | 11.35 | 11.35 | 11.35 | 11.35 | 11.35 | 11.35 | 11.35 |
| EBITAT | -423.9 | -349.1 | 928.0 | 4.1 | 1,555.6 | 268.1 | 357.3 | 476.2 | 634.5 | 845.6 |
| Depreciation | ||||||||||
| Changes in Account Receivables | ||||||||||
| Changes in Inventories | ||||||||||
| Changes in Accounts Payable | ||||||||||
| Capital Expenditure | ||||||||||
| UFCF | 149.4 | -16.0 | 1,440.8 | -48.4 | 1,362.1 | 1,259.0 | 1,324.2 | 1,764.6 | 2,351.5 | 3,133.6 |
| WACC, % | 11.46 | 11.78 | 11.6 | 11.04 | 11.72 | 11.52 | 11.52 | 11.52 | 11.52 | 11.52 |
| PV UFCF | ||||||||||
| SUM PV UFCF | 6,803.0 | |||||||||
| Long Term Growth Rate, % | 2.00 | |||||||||
| Free cash flow (T + 1) | 3,196 | |||||||||
| Terminal Value | 33,574 | |||||||||
| Present Terminal Value | 19,464 | |||||||||
| Enterprise Value | 26,267 | |||||||||
| Net Debt | 8,628 | |||||||||
| Equity Value | 17,639 | |||||||||
| Diluted Shares Outstanding, MM | 321 | |||||||||
| Equity Value Per Share | 55.02 |
What You Will Get
- Comprehensive Financial Model: Starwood Property Trust’s (STWD) actual data facilitates accurate DCF valuation.
- Complete Forecast Control: Modify revenue growth, operating margins, WACC, and other critical drivers.
- Real-Time Calculations: Automatic updates provide immediate insights as you adjust inputs.
- Professional-Grade Template: A polished Excel file crafted for high-quality valuation analysis.
- Flexible and Reusable: Designed for adaptability, enabling multiple uses for in-depth forecasting.
Key Features
- Customizable Investment Parameters: Adjust essential metrics such as rental income growth, operating expenses, and capital investments.
- Instant DCF Valuation: Quickly computes intrinsic value, NPV, and various financial outputs.
- High-Precision Accuracy: Leverages Starwood’s actual financial data for realistic valuation results.
- Simplified Scenario Analysis: Easily evaluate different scenarios and analyze their impacts.
- Efficiency Booster: Avoid the hassle of creating intricate valuation models from the ground up.
How It Works
- Step 1: Download the prebuilt Excel template featuring Starwood Property Trust, Inc. (STWD) data.
- Step 2: Navigate through the pre-filled sheets to familiarize yourself with the essential metrics.
- Step 3: Adjust forecasts and assumptions in the editable yellow cells (WACC, growth, margins).
- Step 4: Instantly see recalculated results, including Starwood Property Trust, Inc. (STWD)'s intrinsic value.
- Step 5: Make well-informed investment decisions or create reports based on the outputs.
Why Choose Starwood Property Trust, Inc. (STWD)?
- Maximize Efficiency: Utilize our resources without the hassle of building models from the ground up.
- Enhance Precision: Access reliable financial insights and methodologies to minimize valuation discrepancies.
- Completely Adaptable: Modify the framework to align with your unique assumptions and forecasts.
- Intuitive Visualization: User-friendly charts and outputs simplify the interpretation of results.
- Endorsed by Professionals: Crafted for industry experts who prioritize accuracy and practicality.
Who Should Use Starwood Property Trust, Inc. (STWD)?
- Real Estate Investors: Make informed investment choices with a reliable property trust analysis tool.
- Financial Analysts: Enhance efficiency with a comprehensive DCF model tailored for real estate.
- Consultants: Easily modify the framework for client meetings or investment reports.
- Real Estate Enthusiasts: Expand your knowledge of property valuation strategies through practical examples.
- Educators and Students: Utilize it as an effective resource in real estate finance education.
What the Template Contains
- Pre-Filled DCF Model: Starwood Property Trust’s financial data preloaded for immediate use.
- WACC Calculator: Detailed calculations for Weighted Average Cost of Capital.
- Financial Ratios: Evaluate Starwood Property Trust’s profitability, leverage, and efficiency.
- Editable Inputs: Change assumptions such as growth, margins, and CAPEX to fit your scenarios.
- Financial Statements: Annual and quarterly reports to support detailed analysis.
- Interactive Dashboard: Easily visualize key valuation metrics and results.
Disclaimer
All information, articles, and product details provided on this website are for general informational and educational purposes only. We do not claim any ownership over, nor do we intend to infringe upon, any trademarks, copyrights, logos, brand names, or other intellectual property mentioned or depicted on this site. Such intellectual property remains the property of its respective owners, and any references here are made solely for identification or informational purposes, without implying any affiliation, endorsement, or partnership.
We make no representations or warranties, express or implied, regarding the accuracy, completeness, or suitability of any content or products presented. Nothing on this website should be construed as legal, tax, investment, financial, medical, or other professional advice. In addition, no part of this site—including articles or product references—constitutes a solicitation, recommendation, endorsement, advertisement, or offer to buy or sell any securities, franchises, or other financial instruments, particularly in jurisdictions where such activity would be unlawful.
All content is of a general nature and may not address the specific circumstances of any individual or entity. It is not a substitute for professional advice or services. Any actions you take based on the information provided here are strictly at your own risk. You accept full responsibility for any decisions or outcomes arising from your use of this website and agree to release us from any liability in connection with your use of, or reliance upon, the content or products found herein.