
|
Sumitomo Chemical India Limited (Sumichem.NS) Évaluation DCF |
Entièrement Modifiable: Adapté À Vos Besoins Dans Excel Ou Sheets
Conception Professionnelle: Modèles Fiables Et Conformes Aux Normes Du Secteur
Pré-Construits Pour Une Utilisation Rapide Et Efficace
Compatible MAC/PC, entièrement débloqué
Aucune Expertise N'Est Requise; Facile À Suivre
Sumitomo Chemical India Limited (SUMICHEM.NS) Bundle
Simplifiez l'évaluation Sumitomo Chemical India Limited (Sumichemns) avec cette calculatrice DCF personnalisable! Doté de véritables produits financiers de Sumitomo Chemical India Limited (Sumichemns) et de prévisions ajustées, vous pouvez tester les scénarios et découvrir la juste valeur Sumitomo Chemical India Limited (Sumichemns) en procès-verbal.
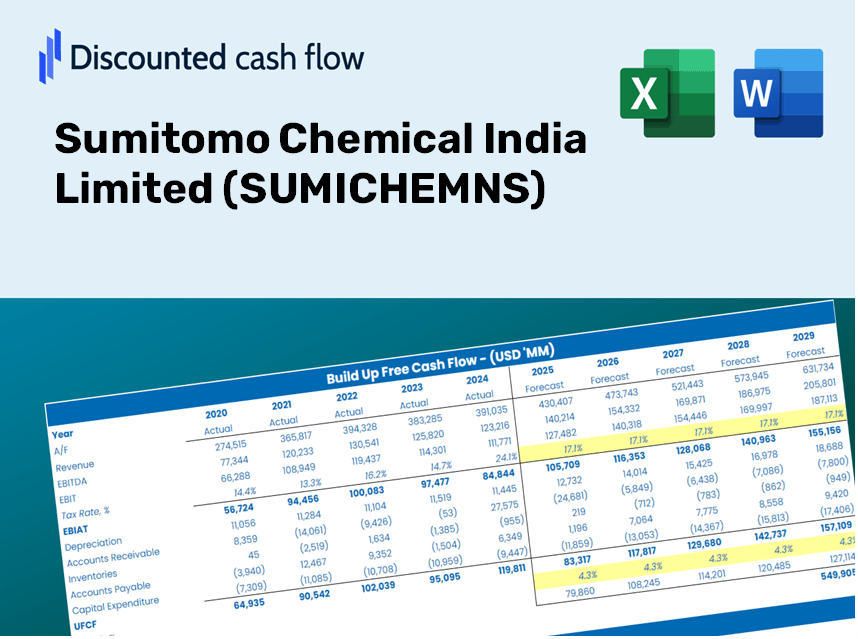
Discounted Cash Flow (DCF) - (USD MM)
| Year | AY1 2021 |
AY2 2022 |
AY3 2023 |
AY4 2024 |
AY5 2025 |
FY1 2026 |
FY2 2027 |
FY3 2028 |
FY4 2029 |
FY5 2030 |
|---|---|---|---|---|---|---|---|---|---|---|
| Revenue | 26,449.1 | 30,612.2 | 35,109.7 | 28,439.5 | 31,485.2 | 33,228.2 | 35,067.7 | 37,009.0 | 39,057.8 | 41,219.9 |
| Revenue Growth, % | 0 | 15.74 | 14.69 | -19 | 10.71 | 5.54 | 5.54 | 5.54 | 5.54 | 5.54 |
| EBITDA | 4,741.0 | 5,822.6 | 6,471.1 | 4,532.9 | 6,095.4 | 6,025.9 | 6,359.5 | 6,711.6 | 7,083.1 | 7,475.2 |
| EBITDA, % | 17.93 | 19.02 | 18.43 | 15.94 | 19.36 | 18.13 | 18.13 | 18.13 | 18.13 | 18.13 |
| Depreciation | 305.4 | 256.4 | 322.5 | 408.9 | 434.8 | 380.7 | 401.8 | 424.1 | 447.5 | 472.3 |
| Depreciation, % | 1.15 | 0.83744 | 0.91844 | 1.44 | 1.38 | 1.15 | 1.15 | 1.15 | 1.15 | 1.15 |
| EBIT | 4,435.6 | 5,566.2 | 6,148.6 | 4,124.0 | 5,660.7 | 5,645.2 | 5,957.7 | 6,287.5 | 6,635.6 | 7,002.9 |
| EBIT, % | 16.77 | 18.18 | 17.51 | 14.5 | 17.98 | 16.99 | 16.99 | 16.99 | 16.99 | 16.99 |
| Total Cash | 5,323.1 | 5,754.1 | 5,635.0 | 8,910.7 | 12,593.8 | 8,393.7 | 8,858.3 | 9,348.7 | 9,866.2 | 10,412.4 |
| Total Cash, percent | .0 | .0 | .0 | .0 | .0 | .0 | .0 | .0 | .0 | .0 |
| Account Receivables | 8,665.3 | 8,786.0 | 9,516.6 | 7,219.5 | 8,852.5 | 9,441.5 | 9,964.2 | 10,515.8 | 11,097.9 | 11,712.3 |
| Account Receivables, % | 32.76 | 28.7 | 27.11 | 25.39 | 28.12 | 28.41 | 28.41 | 28.41 | 28.41 | 28.41 |
| Inventories | 7,543.6 | 9,377.6 | 8,887.0 | 6,104.1 | 7,036.6 | 8,525.0 | 8,996.9 | 9,495.0 | 10,020.6 | 10,575.3 |
| Inventories, % | 28.52 | 30.63 | 25.31 | 21.46 | 22.35 | 25.66 | 25.66 | 25.66 | 25.66 | 25.66 |
| Accounts Payable | 5,912.5 | 5,171.9 | 4,902.1 | 4,300.5 | 4,893.7 | 5,574.1 | 5,882.7 | 6,208.3 | 6,552.0 | 6,914.7 |
| Accounts Payable, % | 22.35 | 16.89 | 13.96 | 15.12 | 15.54 | 16.78 | 16.78 | 16.78 | 16.78 | 16.78 |
| Capital Expenditure | -432.6 | -1,135.2 | -1,198.8 | -637.4 | -294.6 | -793.2 | -837.1 | -883.4 | -932.3 | -984.0 |
| Capital Expenditure, % | -1.64 | -3.71 | -3.41 | -2.24 | -0.93552 | -2.39 | -2.39 | -2.39 | -2.39 | -2.39 |
| Tax Rate, % | 25.69 | 25.69 | 25.69 | 25.69 | 25.69 | 25.69 | 25.69 | 25.69 | 25.69 | 25.69 |
| EBITAT | 3,378.9 | 4,095.0 | 4,720.3 | 3,030.1 | 4,206.6 | 4,226.0 | 4,460.0 | 4,706.9 | 4,967.4 | 5,242.4 |
| Depreciation | ||||||||||
| Changes in Account Receivables | ||||||||||
| Changes in Inventories | ||||||||||
| Changes in Accounts Payable | ||||||||||
| Capital Expenditure | ||||||||||
| UFCF | -7,044.9 | 520.9 | 3,334.3 | 7,279.8 | 2,374.4 | 2,416.6 | 3,338.6 | 3,523.5 | 3,718.5 | 3,924.4 |
| WACC, % | 4.7 | 4.69 | 4.7 | 4.69 | 4.69 | 4.69 | 4.69 | 4.69 | 4.69 | 4.69 |
| PV UFCF | ||||||||||
| SUM PV UFCF | 14,639.5 | |||||||||
| Long Term Growth Rate, % | 4.00 | |||||||||
| Free cash flow (T + 1) | 4,081 | |||||||||
| Terminal Value | 587,408 | |||||||||
| Present Terminal Value | 466,997 | |||||||||
| Enterprise Value | 481,636 | |||||||||
| Net Debt | 91 | |||||||||
| Equity Value | 481,545 | |||||||||
| Diluted Shares Outstanding, MM | 499 | |||||||||
| Equity Value Per Share | 964.74 |
What You Will Receive
- Authentic SUMICHEMNS Financial Data: Pre-filled with Sumitomo Chemical India Limited’s historical and projected figures for accurate analysis.
- Completely Customizable Template: Easily adjust key inputs such as revenue growth, WACC, and EBITDA percentage.
- Instant Calculations: Witness the real-time update of Sumitomo’s intrinsic value as you modify inputs.
- Professional Valuation Tool: Tailored for investors, analysts, and consultants aiming for reliable DCF results.
- Intuitive Design: Straightforward layout and clear guidance suitable for users of all experience levels.
Key Features
- Customizable Forecast Parameters: Adjust essential inputs such as revenue growth, EBITDA %, and capital expenditures.
- Instant DCF Valuation: Automatically computes intrinsic value, NPV, and other financial metrics in real-time.
- High-Precision Accuracy: Leverages Sumitomo Chemical India's (SUMICHEMNS) actual financial data for credible valuation results.
- Effortless Scenario Analysis: Easily explore various assumptions and analyze outcomes side by side.
- Efficiency Booster: Streamlines the valuation process, removing the necessity to create intricate models from the ground up.
How It Works
- Step 1: Download the Excel file for Sumitomo Chemical India Limited (SUMICHEMNS).
- Step 2: Review the pre-filled financial data and forecasts provided for Sumitomo Chemical India Limited (SUMICHEMNS).
- Step 3: Adjust key inputs such as revenue growth, WACC, and tax rates (highlighted cells).
- Step 4: Observe the DCF model refresh in real-time as you modify your assumptions.
- Step 5: Evaluate the outputs and leverage the results for informed investment decisions regarding Sumitomo Chemical India Limited (SUMICHEMNS).
Why Choose This Calculator for Sumitomo Chemical India Limited (SUMICHEMNS)?
- User-Friendly Interface: Crafted for both novices and seasoned professionals.
- Customizable Inputs: Easily adjust parameters to suit your financial analysis.
- Real-Time Adjustments: Observe instant impact on SUMICHEMNS's valuation with input changes.
- Preloaded Data: Comes equipped with Sumitomo Chemical's actual financial metrics for fast assessments.
- Relied Upon by Experts: Utilized by financial analysts and investors for strategic decision-making.
Who Should Utilize This Product?
- Finance Students: Explore valuation methodologies and practice with real market data.
- Academics: Integrate established models into your teaching or scholarly research.
- Investors: Validate your own hypotheses and evaluate valuation results for Sumitomo Chemical India Limited (SUMICHEMNS).
- Analysts: Enhance your efficiency with a ready-to-use, customizable DCF model.
- Small Business Owners: Learn how major public corporations like Sumitomo Chemical India Limited (SUMICHEMNS) are assessed.
What the Template Contains
- Pre-Filled DCF Model: SUMICHEMNS's financial data preloaded for immediate analysis.
- WACC Calculator: Comprehensive calculations for Weighted Average Cost of Capital.
- Financial Ratios: Assess SUMICHEMNS's profitability, leverage, and operational efficiency.
- Editable Inputs: Modify assumptions such as growth rates, profit margins, and capital expenditures to suit your scenarios.
- Financial Statements: Annual and quarterly reports to facilitate in-depth analysis.
- Interactive Dashboard: Effortlessly visualize essential valuation metrics and outcomes.
Disclaimer
All information, articles, and product details provided on this website are for general informational and educational purposes only. We do not claim any ownership over, nor do we intend to infringe upon, any trademarks, copyrights, logos, brand names, or other intellectual property mentioned or depicted on this site. Such intellectual property remains the property of its respective owners, and any references here are made solely for identification or informational purposes, without implying any affiliation, endorsement, or partnership.
We make no representations or warranties, express or implied, regarding the accuracy, completeness, or suitability of any content or products presented. Nothing on this website should be construed as legal, tax, investment, financial, medical, or other professional advice. In addition, no part of this site—including articles or product references—constitutes a solicitation, recommendation, endorsement, advertisement, or offer to buy or sell any securities, franchises, or other financial instruments, particularly in jurisdictions where such activity would be unlawful.
All content is of a general nature and may not address the specific circumstances of any individual or entity. It is not a substitute for professional advice or services. Any actions you take based on the information provided here are strictly at your own risk. You accept full responsibility for any decisions or outcomes arising from your use of this website and agree to release us from any liability in connection with your use of, or reliance upon, the content or products found herein.