
|
SunTeck Realty Limited (SunTeck.NS) Évaluation DCF |
Entièrement Modifiable: Adapté À Vos Besoins Dans Excel Ou Sheets
Conception Professionnelle: Modèles Fiables Et Conformes Aux Normes Du Secteur
Pré-Construits Pour Une Utilisation Rapide Et Efficace
Compatible MAC/PC, entièrement débloqué
Aucune Expertise N'Est Requise; Facile À Suivre
Sunteck Realty Limited (SUNTECK.NS) Bundle
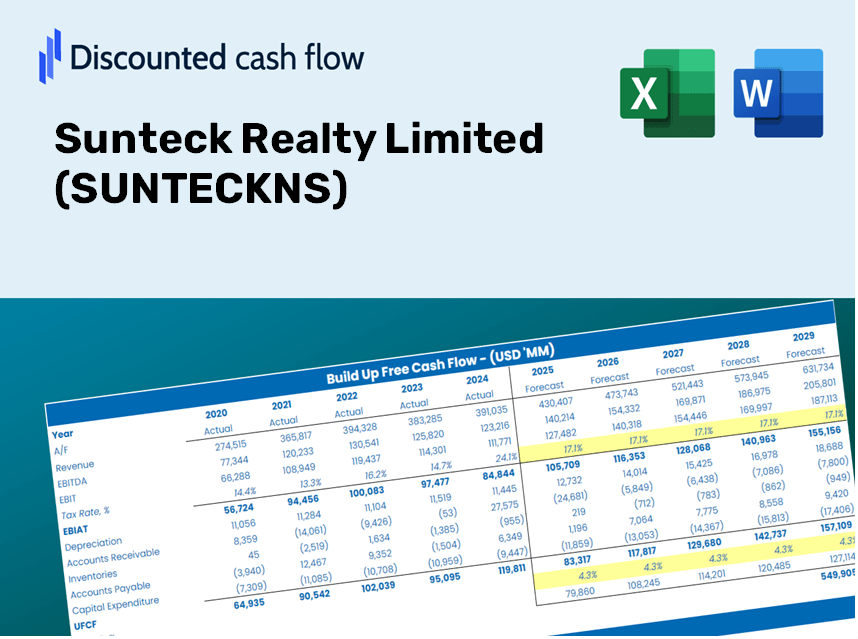
Découvrez le véritable potentiel de SunTeck Realty Limited avec notre calculatrice avancée DCF! Ajustez les hypothèses clés, explorez divers scénarios et évaluez comment les différents changements affectent la valorisation de SunTeck Realty Limited (SunTeckns) - le tout dans un modèle Excel complet.
What You Will Receive
- Flexible Forecast Inputs: Modify assumptions (growth %, profit margins, cost of capital) to explore various scenarios.
- Real-World Data: Sunteck Realty Limited’s financial data pre-loaded to facilitate your analysis.
- Automatic DCF Results: The template computes Net Present Value (NPV) and intrinsic value automatically.
- Customizable and Professional: A sophisticated Excel model tailored to meet your valuation requirements.
- Designed for Analysts and Investors: Perfect for evaluating projections, confirming strategies, and enhancing efficiency.
Key Features
- 🔍 Real-Life SUNTECKNS Financials: Pre-filled historical and projected data for Sunteck Realty Limited.
- ✏️ Fully Customizable Inputs: Modify all essential parameters (yellow cells) such as WACC, growth %, and tax rates.
- 📊 Professional DCF Valuation: Integrated formulas compute Sunteck’s intrinsic value through the Discounted Cash Flow method.
- ⚡ Instant Results: Immediately visualize Sunteck’s valuation after making adjustments.
- Scenario Analysis: Evaluate and compare outcomes for different financial assumptions side-by-side.
How It Works
- Download: Obtain the pre-set Excel file containing Sunteck Realty Limited's financial data.
- Customize: Tailor forecasts such as revenue growth, EBITDA %, and WACC to fit your analysis.
- Update Automatically: Watch as the intrinsic value and NPV calculations refresh in real-time.
- Test Scenarios: Generate various projections and instantly compare the results.
- Make Decisions: Leverage the valuation findings to inform your investment strategy for Sunteck Realty Limited (SUNTECKNS).
Why Choose This Calculator for Sunteck Realty Limited (SUNTECKNS)?
- User-Friendly Interface: Perfectly crafted for both novices and seasoned users.
- Customizable Inputs: Adjust parameters easily to suit your analysis needs.
- Real-Time Feedback: Witness immediate changes in Sunteck's valuation as you tweak the inputs.
- Preloaded Data: Comes with Sunteck's latest financial information for swift evaluations.
- Preferred by Industry Experts: Utilized by investors and analysts for comprehensive decision-making.
Who Can Benefit from This Product?
- Real Estate Investors: Develop comprehensive and precise valuation models for property analysis.
- Corporate Development Teams: Evaluate valuation scenarios to inform strategic planning.
- Consultants and Advisors: Deliver clients reliable valuation insights for Sunteck Realty Limited (SUNTECKNS) stock.
- Students and Educators: Utilize real market data to enhance learning and practice in financial modeling.
- Real Estate Enthusiasts: Gain insights into how real estate firms like Sunteck are valued in the market.
What the Template Includes
- Preloaded SUNTECKNS Data: Historical and projected financial metrics, encompassing revenue, EBIT, and capital expenditures.
- DCF and WACC Models: Advanced templates for computing intrinsic value and Weighted Average Cost of Capital.
- Customizable Inputs: Cells highlighted in yellow for modifying revenue growth, tax rates, and discount rates.
- Financial Statements: Detailed annual and quarterly financial reports for in-depth analysis.
- Key Ratios: Metrics for profitability, leverage, and efficiency to assess performance.
- Dashboard and Charts: Visual representations of valuation results and underlying assumptions.
Disclaimer
All information, articles, and product details provided on this website are for general informational and educational purposes only. We do not claim any ownership over, nor do we intend to infringe upon, any trademarks, copyrights, logos, brand names, or other intellectual property mentioned or depicted on this site. Such intellectual property remains the property of its respective owners, and any references here are made solely for identification or informational purposes, without implying any affiliation, endorsement, or partnership.
We make no representations or warranties, express or implied, regarding the accuracy, completeness, or suitability of any content or products presented. Nothing on this website should be construed as legal, tax, investment, financial, medical, or other professional advice. In addition, no part of this site—including articles or product references—constitutes a solicitation, recommendation, endorsement, advertisement, or offer to buy or sell any securities, franchises, or other financial instruments, particularly in jurisdictions where such activity would be unlawful.
All content is of a general nature and may not address the specific circumstances of any individual or entity. It is not a substitute for professional advice or services. Any actions you take based on the information provided here are strictly at your own risk. You accept full responsibility for any decisions or outcomes arising from your use of this website and agree to release us from any liability in connection with your use of, or reliance upon, the content or products found herein.